
Every so often someone writes Excel's obituary. First databases were going to kill it, then Python, then Power BI, and now artificial intelligence: "why learn formulas if you can ask AI to do it?" Excel turned 40 on September 30, 2025 and, according to Microsoft's own Excel team, it is used by hundreds of millions of people. I have spent more than twenty years teaching math and building Excel and VBA solutions for companies and schools, and my answer is uncomfortable: Excel is not dead in the age of AI; what is dying is a way of using it. The way of the professional who copies, pastes, rebuilds the same report every Monday and never learned what lies beyond VLOOKUP.
In this article I show you the data (jobs, small businesses, costs), the modern Excel stack that almost nobody takes advantage of, where Excel is not the right tool and how the job changes when AI writes the formulas. And, as always, I leave you copy-paste examples: formulas, Power Query, DAX, a VBA macro, an Office Script, Python and Copilot prompts, all tested.
Is Excel dead? What the data says
Let's start with the job market. O*NET, the occupational information system of the US Department of Labor, publishes the technologies most requested in job postings using Lightcast data. Between January 1 and December 31, 2025, out of 46.9 million unique postings, Microsoft Excel appeared in 3,211,598: the second most requested technology, behind only the Office suite in general. Python appeared in 814,960 postings, SQL in 758,250 and Power BI in 357,898. Excel alone beats the three combined. This is not new: in 2015, Burning Glass's Crunched by the Numbers found that spreadsheet and word processing skills were already a baseline requirement in 78% of middle-skill jobs.
Now the other side. The World Economic Forum's Future of Jobs Report 2025 estimates that 39% of today's skills will be transformed or become outdated between 2025 and 2030; for Colombia the estimate is 44%, among the highest of the 55 economies studied. Analytical thinking remains the core skill (seven in ten companies consider it essential), and the fastest-growing skills are AI and big data, networks and cybersecurity, and technological literacy. Microsoft and LinkedIn's 2024 Work Trend Index adds that 75% of knowledge workers already use AI and 66% of leaders would not hire someone without AI skills.
What about Colombia? I looked for a reliable figure on the share of job openings that ask for Excel and found none; I would rather say so than make one up. What does exist is hard data about companies. According to DANE (EMICRON 2024), the country has 5.3 million micro-businesses: 68.2% keep no accounting records, 27.1% keep informal accounts "in a notebook, an Excel sheet or a cash register" and only 4.7% use a formal accounting method. Just 10.9% used a computer, tablet or laptop for their activity. Confecámaras reports that, at the end of 2025, 99.5% of the country's 1,805,564 companies were micro, small or medium-sized, and the Ministry of Commerce estimates they generate more than 78% of employment.
Across Latin America, ECLAC notes that MSMEs make up about 99% of companies and employ around 67% of workers, but large firms can be up to 33 times more productive than micro-enterprises; in OECD countries that gap ranges from 1.3 to 2.4 times. Even in Europe the data analytics gap is huge: according to Eurostat, in 2025 35.1% of small firms (10 to 49 employees) analysed data, compared with 82.0% of large ones.
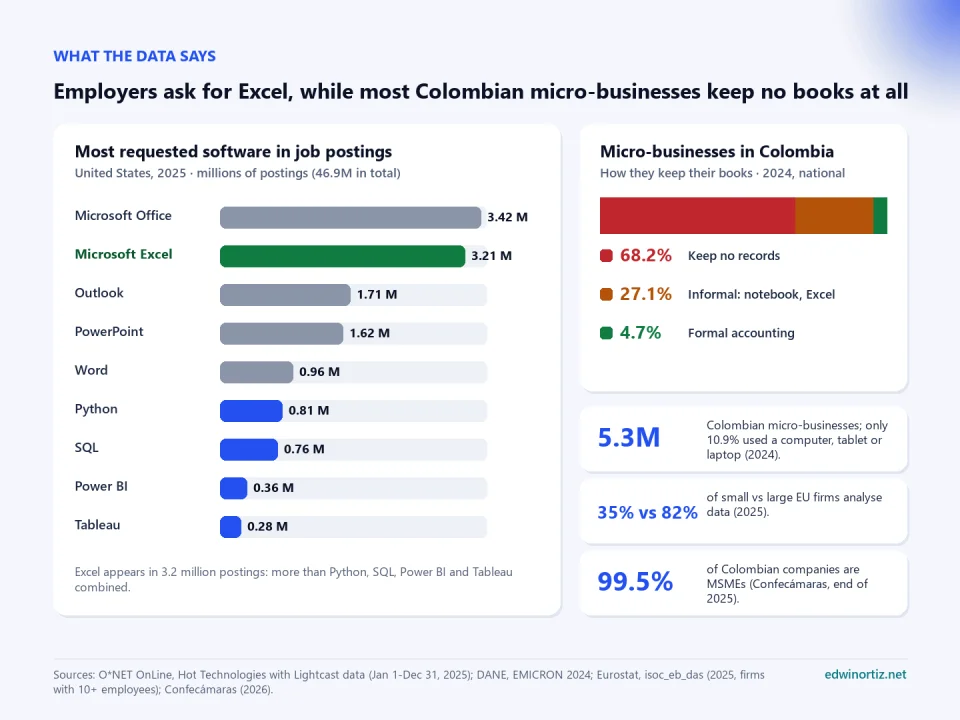
My reading: the market is not abandoning Excel; it is no longer paying for basic Excel. And the Latin American small business does not have an "old Excel" problem, it has a not-measuring problem: for a micro-business that writes its sales in a notebook, a well-built table with a PivotTable already is digital transformation.
What did die: copy-and-paste Excel
Here is a quick test. If you recognize yourself in three or more of these habits, your way of using Excel is at risk, even if Excel is not:
- Every month you open twelve files, copy their data and paste it one below the other.
- You use VLOOKUP counting columns by hand and, if someone inserts a column, everything breaks.
- Your reports contain hand-typed totals "because the formula didn't work".
- You build the same report every week with the same clicks in the same order.
- You don't know what an Excel table (Ctrl+T), Power Query or a measure is.
- You paste the formula AI gave you and, if it returns a number, you assume it is right.
The last point is the most dangerous one in 2026: AI automates mechanical work first, but not the judgment to know whether a number makes sense. I developed this idea in AI won't replace you. Someone who masters it will, and it applies here literally.
The modern Excel stack: much more than a grid
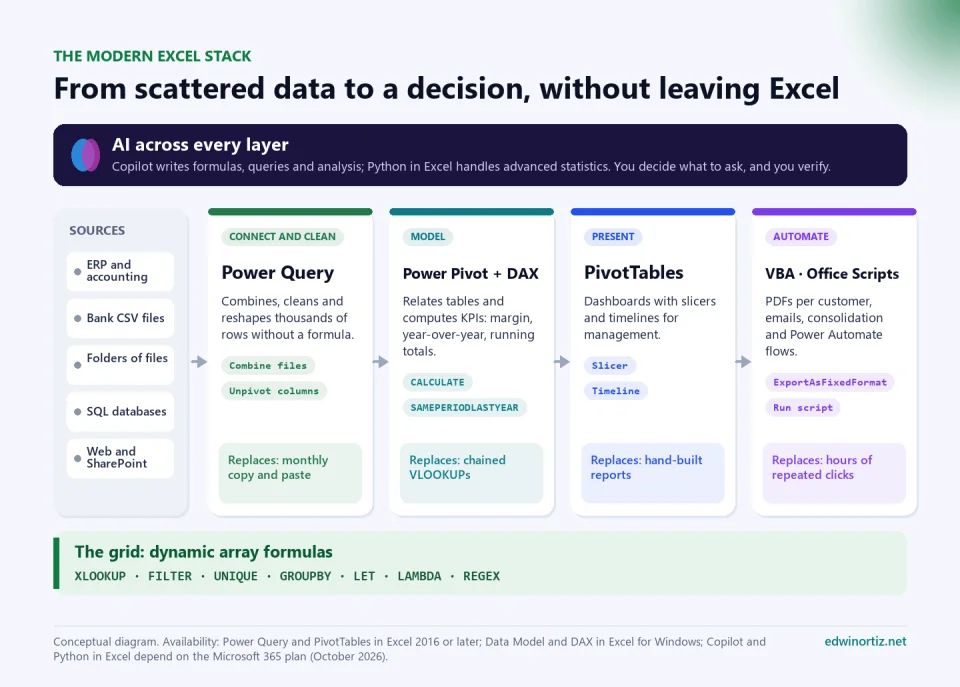
Today's Excel is a complete chain: it connects, cleans, models, presents and automates, with AI at every step. This is the map:
Dynamic array formulas: XLOOKUP, FILTER, UNIQUE, GROUPBY and LAMBDA
In Microsoft 365 (and largely in Excel 2021), one formula can return an entire table that "spills" on its own. Imagine a Sales table with Date, Rep, Customer, City, Product, Category, Units and Total columns, plus a Customers table. I tested these formulas in Excel (in Spanish, the names in parentheses):
1) XLOOKUP (BUSCARX): bring the customer name without counting columns
=XLOOKUP([@Customer], Customers[Code], Customers[Name], "Not found")

2) GROUPBY (AGRUPARPOR): total per rep, largest first, with a grand total
=GROUPBY(Sales[Rep], Sales[Total], SUM, , , -2)

3) PIVOTBY (PIVOTARPOR): categories in rows, months (202601, 202602...) in columns
=PIVOTBY(Sales[Category], YEAR(Sales[Date]) * 100 + MONTH(Sales[Date]), Sales[Total], SUM)

4) FILTER + SORTBY (FILTRAR, ORDENARPOR): Bogotá sales above 1 million
=SORTBY(FILTER(Sales, (Sales[City] = "Bogotá") * (Sales[Total] > 1000000), "No data"),
        FILTER(Sales[Total], (Sales[City] = "Bogotá") * (Sales[Total] > 1000000)), -1)

5) UNIQUE (UNICOS): how many different customers Ana served
=COUNTA(UNIQUE(FILTER(Sales[Customer], Sales[Rep] = "Ana")))

6) LET: a readable ranking with intermediate names
=LET(r, UNIQUE(Sales[Rep]),
     t, SUMIF(Sales[Rep], r, Sales[Total]),
     SORTBY(HSTACK(r, t), t, -1))

7) TEXTSPLIT (DIVIDIRTEXTO): split a product code "SHI-BLU-M"
=TEXTSPLIT(A2, "-")                        → SHI | BLU | M

8) Regular expressions (REGEXEXTRACCION, REGEXPRUEBA, REGEXREEMPLAZAR)
=REGEXEXTRACT(A2, "[\w.+-]+@[\w-]+(\.[\w-]+)+")      → pulls the email out of a text
=REGEXTEST(B2, "^3\d{9}$")                            → is it a valid Colombian mobile number?
=REGEXREPLACE(C2, "\D", "")                           → "(310) 456-78 90" becomes 3104567890
Look at formula 3. If you ask an AI for "sales by month", it almost always suggests TEXT(Sales[Date], "yyyy-mm"). But the format codes inside TEXT depend on regional settings. I tested the Spanish version, TEXTO(...; "aaaa-mm"), on a Windows PC set to Colombia and got "jueves-03": there "aaaa" means the weekday name and the year is written "yyyy". That is why I prefer YEAR()*100+MONTH(), which works the same in any language. It is a perfect example of why a formula that "looks right" must be checked.
The gem is LAMBDA: it lets you create your own functions without a line of VBA. In Formulas > Name Manager > New, create the name COMMISSION with this definition:
Name: COMMISSION
Refers to:
=LAMBDA(sale, target,
    LET(pct, sale / target,
        IF(pct >= 1, sale * 5%,
           IF(pct >= 0.8, sale * 3%, 0))))

Use it in any cell of the workbook:
=COMMISSION([@Total], [@Target])   → 12,000,000 with a 10,000,000 target = 600,000
                                     8,500,000 with a 10,000,000 target = 255,000
If the commission policy changes tomorrow, you fix it in one place and the whole workbook updates. That is thinking like a programmer while remaining an Excel user. For more LAMBDA functions for analysts, see Excel with artificial intelligence: practical examples.
Power Query: cleaning thousands of rows without a single formula
Power Query is the tool that gives back the most hours and the least known one. It connects to files, folders, SQL databases, SharePoint or the web, records every cleaning step, and next month you just click Refresh All. The classic case: each branch sends its file with products in rows and months in columns. In the interface:
- Data > Get Data > From File > From Folder, choose the folder and click Transform Data.
- Filter the .xlsx extension and combine the files using the first sheet.
- Add the Branch column from the file name.
- Remove empty rows, trim spaces and capitalize names.
- Select Branch and Product and choose Unpivot Other Columns: months become rows.
- Close & Load to a table or directly into the Data Model.
And this is the complete M code. Paste it into Get Data > From Other Sources > Blank Query > Advanced Editor and change the path:
let
    // 1) All files in the folder (one per branch: "North.xlsx", "Downtown.xlsx"...)
    Source = Folder.Files("C:\Sales\Branches"),
    Workbooks = Table.SelectRows(Source, each [Extension] = ".xlsx"
                    and not Text.StartsWith([Name], "~$")),

    // 2) From each workbook, the first sheet with row 1 as headers,
    //    plus a Branch column taken from the file name
    WithData = Table.AddColumn(Workbooks, "Data", each
        let
            branch = Text.BeforeDelimiter([Name], "."),
            sheets = Table.SelectRows(Excel.Workbook([Content], true), each [Kind] = "Sheet"),
            sheet = sheets{0}[Data]
        in
            Table.AddColumn(sheet, "Branch", each branch, type text)),
    Combined = Table.Combine(WithData[Data]),

    // 3) Cleaning: no empty rows, no extra spaces, consistent names
    NoBlanks = Table.SelectRows(Combined, each [Product] <> null
                   and Text.Trim(Text.From([Product])) <> ""),
    Clean = Table.TransformColumns(NoBlanks,
                {{"Product", each Text.Proper(Text.Trim(Text.From(_))), type text}}),

    // 4) Unpivot: months move from columns to rows
    Rows = Table.UnpivotOtherColumns(Clean, {"Branch", "Product"}, "Month", "Sales"),
    Typed = Table.TransformColumnTypes(Rows, {{"Sales", type number}}, "en-US"),
    NoErrors = Table.RemoveRowsWithErrors(Typed, {"Sales"}),
    Final = Table.SelectRows(NoErrors, each [Sales] <> null and [Sales] <> 0)
in
    Final
I tested it with three "dirty" files (extra spaces, capital letters, empty rows and an "n/a" where a number should be) and it returned a clean table with Product, Branch, Month and Sales. An auditing tip: the NoErrors step drops anything that is not a number; check how many rows it removes, because an "n/a" may be a figure someone forgot to report.
Power Pivot and DAX: your own small BI at home
The Data Model relates several tables like a database and computes indicators with DAX, the same language Power BI uses. With a Calendar table (one row per day) and a Products table related to Sales, these measures cover almost everything a manager asks for:
Total Sales := SUM ( Sales[Total] )

Total Cost := SUMX ( Sales, Sales[Units] * RELATED ( Products[Cost] ) )

Margin % := DIVIDE ( [Total Sales] - [Total Cost], [Total Sales] )

Sales Last Year := CALCULATE ( [Total Sales], SAMEPERIODLASTYEAR ( Calendar[Date] ) )

YoY % := DIVIDE ( [Total Sales] - [Sales Last Year], [Sales Last Year] )

Year to Date := TOTALYTD ( [Total Sales], Calendar[Date] )

Running Total :=
CALCULATE (
    [Total Sales],
    FILTER ( ALL ( Calendar[Date] ), Calendar[Date] <= MAX ( Calendar[Date] ) )
)
I verified them in a test model against hand calculations: a 43.75% margin, +7.5% for June and exact running totals. And the model taught me a lesson: for all of 2026 the year-over-year change was −46%, because 2026 only had data through June and was compared with the full 2025. The DAX was right; the question was wrong. If your regional settings use a decimal comma and Power Pivot rejects commas between arguments, use semicolons.
Advanced PivotTables: what impresses a director
On top of that model, a PivotTable becomes a dashboard: slicers by rep and city, a timeline to pick months with the mouse, Show Values As > % of Row Total to see the product mix, and the YoY % measure with conditional formatting. If you connect several PivotTables to the same slicers (Report Connections), you have an interactive dashboard without paying for an extra license. I have a step-by-step guide in PivotTables in Excel: analyze data like a pro.
VBA and Office Scripts: automating what you do every week
VBA is more than 30 years old and is still the most direct way to automate desktop Excel on Windows. This macro takes the Sales sheet, creates one PDF per rep in a dated folder and, if you turn it on, prepares an Outlook email with each PDF attached. I tested it with sample data: three reps, three PDFs, no leftover temporary sheets or forgotten filters.
Option Explicit

' Splits the "Sales" sheet into one PDF per rep and, if you want, prepares
' an Outlook email with each PDF attached (it displays it, it does not send it).
' Requirements: data from A1 with headers; an "Emails" sheet with the rep
' in column A and the email in column B (only if SEND_MAIL = True).

Private Const DATA_SHEET As String = "Sales"
Private Const REP_COL As Long = 2               ' B = Rep
Private Const SEND_MAIL As Boolean = False      ' True = prepare emails

Public Sub CreatePdfPerRep()
    Dim ws As Worksheet, tmp As Worksheet
    Dim data As Range, cell As Range
    Dim reps As Object, v As Variant
    Dim folder As String, file As String, n As Long

    Set ws = ThisWorkbook.Worksheets(DATA_SHEET)
    If ws.AutoFilterMode Then ws.AutoFilterMode = False
    Set data = ws.Range("A1").CurrentRegion
    If data.Rows.Count < 2 Then
        MsgBox "The " & DATA_SHEET & " sheet has no data.", vbExclamation
        Exit Sub
    End If

    ' Output folder next to the workbook: PDF_2026-10-09
    folder = ThisWorkbook.Path & Application.PathSeparator & "PDF_" & Format(Date, "yyyy-mm-dd")
    If Dir(folder, vbDirectory) = "" Then MkDir folder

    ' Unique reps (case-insensitive)
    Set reps = CreateObject("Scripting.Dictionary")
    reps.CompareMode = vbTextCompare
    For Each cell In data.Columns(REP_COL).Offset(1).Resize(data.Rows.Count - 1).Cells
        If Len(Trim$(CStr(cell.Value))) > 0 Then reps(Trim$(CStr(cell.Value))) = True
    Next cell

    Application.ScreenUpdating = False
    On Error GoTo Failed
    For Each v In reps.Keys
        ' Filter the rep and copy only the visible rows to a temporary sheet
        data.AutoFilter Field:=REP_COL, Criteria1:="=" & v
        Set tmp = ThisWorkbook.Worksheets.Add(After:=ws)
        data.SpecialCells(xlCellTypeVisible).Copy tmp.Range("A1")
        tmp.Columns.AutoFit
        With tmp.PageSetup
            .Orientation = xlLandscape
            .Zoom = False
            .FitToPagesWide = 1
            .FitToPagesTall = False
            .CenterHeader = "Sales for " & v
            .RightFooter = "Page &P of &N"
        End With
        file = folder & Application.PathSeparator & SafeName(CStr(v)) & ".pdf"
        tmp.ExportAsFixedFormat Type:=xlTypePDF, Filename:=file, OpenAfterPublish:=False
        Application.DisplayAlerts = False
        tmp.Delete
        Application.DisplayAlerts = True
        Set tmp = Nothing
        If SEND_MAIL Then PrepareEmail CStr(v), file
        n = n + 1
    Next v

Failed:
    ' Whatever happens: remove the filter, delete the temporary sheet, restore the screen
    If Not tmp Is Nothing Then
        Application.DisplayAlerts = False
        tmp.Delete
        Application.DisplayAlerts = True
    End If
    If ws.AutoFilterMode Then ws.AutoFilterMode = False
    Application.ScreenUpdating = True
    If Err.Number <> 0 Then
        MsgBox "Error with " & v & ": " & Err.Description, vbCritical
    Else
        MsgBox n & " PDFs saved in:" & vbLf & folder, vbInformation
    End If
End Sub

' Creates an Outlook email with the PDF attached and displays it for review.
Private Sub PrepareEmail(ByVal rep As String, ByVal file As String)
    Dim address As Variant, ol As Object, msg As Object
    address = Application.VLookup(rep, ThisWorkbook.Worksheets("Emails").Range("A:B"), 2, False)
    If IsError(address) Then Exit Sub                 ' no email on file: skip
    Set ol = CreateObject("Outlook.Application")
    Set msg = ol.CreateItem(0)
    With msg
        .To = address
        .Subject = "Your sales report - " & Format(Date, "mmmm yyyy")
        .Body = "Hi " & rep & "," & vbLf & vbLf & _
                "Attached is your sales report. Let me know if anything looks off." & vbLf
        .Attachments.Add file
        .Display                                       ' switch to .Send once you trust the process
    End With
End Sub

' Removes characters Windows does not allow in a file name.
Private Function SafeName(ByVal s As String) As String
    Dim c As Variant
    For Each c In Array("\", "/", ":", "*", "?", """", "<", ">", "|")
        s = Replace(s, c, "_")
    Next c
    SafeName = Left$(Trim$(s), 100)
End Function
To use it: Alt+F11 > Insert > Module, paste the code, save as .xlsm and run it with Alt+F8. Emails are displayed, not sent; errors never leave filters on; file names are sanitized. If you need the same with Word templates, hundreds of recipients, CC and BCC or different attachments per person, I already solved it in two templates: Send mass emails with attachments, CC and BCC and Mail merge to individual PDFs.
The modern version is Office Scripts (TypeScript, Automate tab) for Excel on the web, Windows and Mac with business or education licenses. Their advantage is the connection with Power Automate: according to Microsoft's documentation, the Run script action allows up to 1,600 calls per user per day, with a 120-second limit per run. This script rebuilds a Summary sheet with totals per rep and returns text for an email:
function main(workbook: ExcelScript.Workbook): string {
  const table = workbook.getTable("Sales");
  if (!table) {
    throw new Error("Sales table not found");
  }
  const headers = table.getHeaderRowRange().getValues()[0] as string[];
  const iRep = headers.indexOf("Rep");
  const iTotal = headers.indexOf("Total");

  // Add up each rep's total
  const totals = new Map<string, number>();
  for (const row of table.getRangeBetweenHeaderAndTotal().getValues()) {
    const rep = String(row[iRep]).trim();
    totals.set(rep, (totals.get(rep) || 0) + Number(row[iTotal]));
  }
  const rows = Array.from(totals.entries()).sort((a, b) => b[1] - a[1]);
  if (rows.length === 0) {
    return "The Sales table is empty";
  }

  // Rebuild the Summary sheet on every run
  workbook.getWorksheet("Summary")?.delete();
  const sheet = workbook.addWorksheet("Summary");
  sheet.getRange("A1:B1").setValues([["Rep", "Total"]]);
  sheet.getRange("A1:B1").getFormat().getFont().setBold(true);
  sheet.getRangeByIndexes(1, 0, rows.length, 2).setValues(rows);
  sheet.getRangeByIndexes(1, 1, rows.length, 1).setNumberFormat("$#,##0");
  sheet.getRange("A:B").getFormat().autofitColumns();

  // Text Power Automate can drop into the body of an email
  return rows.map(([r, t]) => `${r}: $${t.toLocaleString("en-US")}`).join("\n");
}
In Power Automate the flow has three steps: Recurrence (Mondays, 7:00), Run script on the workbook in OneDrive or SharePoint, and Send an email with the result. The manager gets the summary before arriving at the office, and nobody opened Excel.
Copilot and Python in Excel: AI inside the sheet
The picture as of October 2026: Copilot's Agent Mode, which edits the workbook in several steps, is generally available in Excel for the web, Windows and Mac; the =COPILOT() cell function was retired on September 14, 2026 without ever leaving preview; and Python in Excel is available for business plans on Windows, Mac and the web, and in preview for Personal and Family. Licensing and agent details are in my guide to Copilot and agents in Excel. Here I care about the difference between an amateur prompt and a professional one.
WEAK PROMPT
Analyze the sales.

PROFESSIONAL PROMPT
Use the Sales table (Date, Rep, City, Product, Total).
Goal: prepare the October sales committee.
1) In a new sheet, create the total per rep and month with formulas
   (GROUPBY or PIVOTBY), never with pasted values.
2) Calculate the change from August to September per rep.
3) Point out the three products that fell the most and in which city.
4) Add a Control cell that compares the summary total with
   SUM(Sales[Total]); it must return 0.
Show me the plan before changing the workbook.
The first produces a generic paragraph; the second produces auditable formulas and a cell that tells you if something got lost along the way. And for real statistics, a =PY cell classifies inventory with the ABC (Pareto) method in five lines; I tested the logic with pandas:
# =PY cell: ABC classification of products by sales
df = xl("Sales[#All]", headers=True)
abc = df.groupby("Product", as_index=False)["Total"].sum().sort_values("Total", ascending=False)
abc["Cumulative %"] = abc["Total"].cumsum() / abc["Total"].sum()
abc["Class"] = np.where(abc["Cumulative %"] <= 0.8, "A", np.where(abc["Cumulative %"] <= 0.95, "B", "C"))
abc
How to verify what AI produces, in four steps that do not depend on it: demand formulas, not values; open three formulas at random and read them; add a control cell that compares totals and must return zero; and test a case whose result you know by heart. If you can't read the formula Copilot wrote, you are not using AI: you are gambling.
How the job changes: AI amplifies whoever understands the data
This is the core of my argument: AI does not level everyone up, it multiplies what you already know. For the analyst who understands tables, relationships and comparable periods, Copilot saves hours, and he or she spots the error in seconds. For someone who doesn't know what a data model is, the same AI confidently delivers a report comparing six months with twelve, like the −46% above. Both "use AI"; only one works better.
That is why the World Economic Forum does not contradict itself: AI and data skills are growing, and analytical thinking is still the most valued. For most people, Excel is where that thinking is learned: what a row is, a key, a total that reconciles. Those who master it make the most of AI; those who don't depend on it.
Excel in small businesses: the low-cost BI you already have installed
For a small Colombian business, the question is not "Excel or Power BI" but how much each step costs and what it returns. These are US list prices per user per month, paid annually, checked on Microsoft's pages:
| Tool | List price | What it adds |
|---|---|---|
| Microsoft 365 Business Standard | USD 14 (since July 1, 2026; previously 12.50) | Desktop Excel with Power Query, Power Pivot, PivotTables and VBA, plus email and Teams |
| Microsoft 365 Business Basic | USD 7 | Excel for the web and mobile (no desktop Excel) |
| Power BI Desktop | Free | Models and dashboards on your computer, no online sharing |
| Power BI Pro | USD 14 | Publish and share dashboards with the team |
| Microsoft 365 Copilot Business | USD 21 (USD 18 promotion through December 31, 2026) | Copilot in Excel, Word, Outlook and Teams for companies with fewer than 300 users |
| Microsoft 365 Copilot (enterprise) | USD 30 | Full Copilot with agents |
Sources: Microsoft 365 2026 pricing updates, Power BI pricing, Copilot Business announcement and Microsoft 365 Copilot pricing. As an outside reference, Tableau's pricing page starts at USD 75 per user per month for a Creator, and an ERP also means implementation, training and months of adjustments.
The math for a five-person business: with Business Standard it pays USD 70 a month and has the whole stack; if one person publishes dashboards, add USD 14 for Power BI Pro. I am not saying small businesses never need an ERP; I am saying many buy software before knowing what they want to measure and end up exporting from the ERP… to Excel. I would do it the other way around: organize the data, measure with PivotTables, automate the repetitive work and, when the spreadsheet falls short, migrate with your indicators already defined.
Use cases by role: formulas for tomorrow morning
Accounting: bank reconciliation with a date tolerance
The bank records a payment on the 5th and the ledger on the 6th. XLOOKUP with multiple conditions finds the same amount within three days and returns the voucher:
Voucher column in the Bank table:
=XLOOKUP(1, (Ledger[Amount] = [@Amount]) * (ABS(Ledger[Date] - [@Date]) <= 3),
         Ledger[Voucher], "Pending")

Total still to reconcile:
=SUMIF(Bank[Voucher], "Pending", Bank[Amount])
In my test, a September 1 payment matched the August 30 voucher, and another one for the same amount on September 12 stayed pending because the ledger had it on the 20th: exactly what an accountant needs to review. For error-free invoicing, the invoice with email delivery handles numbering and sending, and the number-to-words converter includes a free Excel module.
Small business owner: cash flow and inventory
Week-by-week cash balance from an opening balance in B1 (SCAN):
=SCAN(B1, CashFlow[Inflows] - CashFlow[Outflows], LAMBDA(balance, mov, balance + mov))

Reorder alert based on the last 30 days of sales:
=LET(daily, SUMIFS(Sales[Units], Sales[Product], [@Product],
                   Sales[Date], ">=" & TODAY() - 30) / 30,
     point, daily * [@[Lead time days]] + [@[Safety stock]],
     IF([@[On hand]] <= point, "Order now", "OK"))
With an opening balance of 1,000,000, inflows of 5,000,000 and outflows of 3,200,000, SCAN returns 2,800,000 in week one and keeps accumulating: if a week is going negative, you see it before it happens. To label assets and stock, the label generator with QR and barcodes prints them from the same table.
HR: overtime and attendance
Overtime for a shift, even if it crosses midnight:
=LET(h, MOD([@Out] - [@In], 1) * 24, MAX(0, h - 8))

Attendance rate for one row (P = present):
=COUNTIF(C2:X2, "P") / COUNTA(C2:X2)
MOD solves the classic 10:00 p.m. to 6:00 a.m. shift that returns negative hours. Night and Sunday premiums depend on current law and your agreements, so put the rates in a parameter table, not inside the formula. If you track attendance, the work or school attendance sheet already has the calculations.
Sales: commission dashboard
Combine the above: COMMISSION as a calculated column, GROUPBY for totals per rep, a PivotTable with a month slicer and the PDF macro so every rep receives their statement. What took an afternoon now takes minutes.
Teachers and school leaders: grades and attendance
Final grade with term weights (C2:E2 grades, Weights in H2:H4):
=ROUND(SUMPRODUCT(C2:E2, TRANSPOSE(Weights)), 1)

Performance level from the school's grading scale (Scale table sorted by From):
=XLOOKUP([@Final], Scale[From], Scale[Level], "No grade", -1)
If you teach, AI helps most with preparing lessons and assessments: I built the AI Kit for Teachers with tested prompts by subject and the AI exam generator, which creates versions and answer keys. What comes next, consolidating grades, belongs in Excel.
Logistics: on time, in full (OTIF)
Share of orders delivered on time and complete:
=AVERAGE((Shipments[Delivered] <= Shipments[Promised]) *
         (Shipments[Qty delivered] >= Shipments[Qty ordered]))
With four test orders (one late, one incomplete), the formula returned 0.5: a 50% OTIF, the indicator a wholesale customer cares about most. And if your shipments carry codes, the bulk QR code generator creates them in batches; you can also download the free =QR() module from the QR generator.
How much time you save: manual vs automated
This table is illustrative: estimates based on processes I have automated with clients and colleagues, not a statistical measurement. Your case may vary, but the order of magnitude repeats:
| Task | Manual | Automated | Tool |
|---|---|---|---|
| Consolidate 12 branch files every month | 3 to 4 hours | 2 minutes (Refresh All) | Power Query |
| Create and send 40 PDFs per rep or customer | 2 to 3 hours | 5 minutes | VBA |
| Reconcile 600 bank transactions | A full day | 1 hour (review pending items only) | XLOOKUP and Power Query |
| Monthly report with year-over-year comparison | 4 hours | 15 minutes | Power Pivot and PivotTables |
| Weekly summary email to the manager | 45 minutes | 0 (scheduled) | Office Scripts and Power Automate |
| Consolidate grades for six classes | A full day | 1 hour | Dynamic array formulas |
To learn how to build them, How to automate tasks in Excel and reduce errors explains the logic, and my Excel playlist on YouTube (in Spanish) has step-by-step tutorials, from formulas to macros.
Where Excel is not the right tool
Defending Excel does not mean defending it for everything. These are its real limits, with documented cases:
- Volume. A worksheet holds 1,048,576 rows by 16,384 columns. The Data Model handles many more, but for tens of millions of records growing every day you need a database.
- Many users writing at once. Co-authoring is for editing a workbook, not for thirty people entering simultaneous orders with integrity rules: that is a database's job.
- Version control. "Final_report_v3_really_final.xlsx" is not version control. If a number affects public money, health or investments, you need peer review and a change log.
- Critical processes without review. In October 2020, Public Health England failed to report 15,841 positive COVID-19 cases between September 25 and October 2 because files exceeded their maximum size; the BBC explained that the old .xls format, limited to 65,536 rows, was being used.
- Financial models copied by hand. JPMorgan's internal report on the "London Whale" (losses of more than USD 6 billion in 2012) describes a risk model in Excel sheets filled in by copying and pasting, with a formula that divided by the sum instead of the average.
- Academic research. In 2013, Herndon, Ash and Pollin found that Reinhart and Rogoff's influential study on debt and growth left out five countries because of a wrongly selected Excel range. That error explained only part of the difference (the rest came from data exclusions and questionable weighting), but it was enough to cast doubt on a thesis widely cited in the austerity debate.
- Automatic conversions. A 2016 study in Genome Biology found that about one in five papers with gene lists in Excel had names converted into dates (SEPT1 became "1-Sep"). In 2020 the international nomenclature committee renamed those genes (SEPT1 is now SEPTIN1).
And a humbling figure: across studies that thoroughly inspected 85 spreadsheets, Ray Panko reported errors in 94% of them. The lesson is not to abandon Excel but to use it like a professional: structured tables, Power Query instead of copy and paste, control cells and a second person to review. Almost all of those disasters came from manual processes, exactly what the modern stack eliminates.
Are you obsolete? A level 1 to 5 self-assessment and learning roadmap
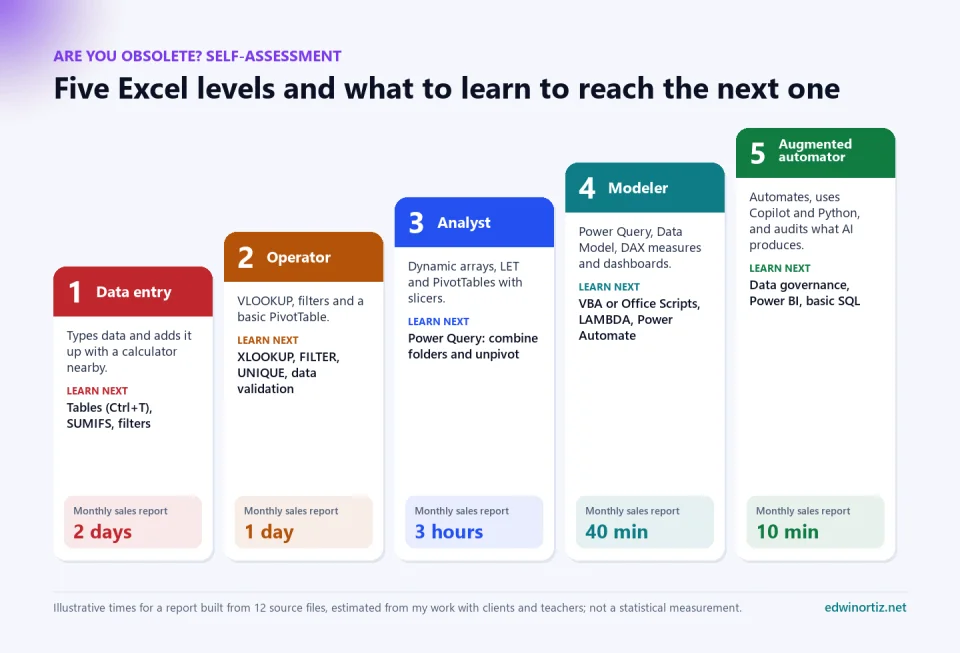
Place yourself honestly. Check what you already do without searching online:
- Level 1, data entry: you type data and add it up with a calculator nearby. Learn next: tables with Ctrl+T, SUMIFS, filtering and sorting.
- Level 2, operator: you use VLOOKUP, filters and a basic PivotTable. Learn: XLOOKUP, FILTER, UNIQUE and data validation.
- Level 3, analyst: you use dynamic arrays, LET and PivotTables with slicers. Learn: Power Query to combine folders and unpivot.
- Level 4, modeler: you work with Power Query, the Data Model, DAX measures and dashboards. Learn: VBA or Office Scripts, LAMBDA and Power Automate.
- Level 5, augmented automator: you automate, use Copilot and Python, and audit what AI produces. Learn: data governance, Power BI and basic SQL.
Move up one level per quarter by applying it to a real report from your job. A level 3 with judgment is worth more than a level 1 with a Copilot license.
Start today without starting from scratch. Download the free Excel with AI kit (macros to profile data and classify it with your own free Gemini key) and the number-to-words and QR code modules. When you want to automate a whole process, the Excel and automation section has the templates I use with my clients: mass emails with attachments, separate Word and PDF documents, invoice with automatic numbering and, if you want me by your side during implementation, PLUS support.
Frequently asked questions
Will Excel disappear because of artificial intelligence?
There are no signs of that. Microsoft is building AI into Excel (Copilot, Agent Mode, Python), and in 2025 Excel appeared in more than 3.2 million job postings in the United States alone. What is losing value is manual, repetitive use.
What should I learn first so I don't fall behind?
Tables (Ctrl+T), XLOOKUP and FILTER, PivotTables and then Power Query. With those four you can automate most of an office's repetitive work. After that, DAX or macros depending on your role.
Is it better to learn Python or Power BI instead of Excel?
They are not mutually exclusive: Power Query and DAX are the same in Excel and Power BI, and Python already runs inside Excel. For most administrative roles, modern Excel is the first step and the one with the best return.
Do I need to pay for Copilot to use AI with Excel?
Not necessarily. You can ask ChatGPT, Gemini or Claude for formulas by describing your table without pasting personal data, or use my free ExcelConIA module. Copilot works inside the workbook, but verification is still on you.
Are VBA macros still useful in 2026?
Yes. In desktop Excel for Windows they are the most direct way to automate files, PDFs and emails. For Excel on the web and cloud flows, the alternative is Office Scripts with Power Automate.
Food for thought
For decades, knowing Excel was an advantage; then it became a requirement; now AI promises you won't need to know it at all. But when anyone can ask a machine to "build the report", the value will no longer be in building it but in knowing whether it is right. If a generation learns to ask for formulas without learning to read them, are we training more productive professionals or people who sign off on numbers they don't understand? And who should answer for that gap: each worker, the companies that demand speed, or the schools and universities that still teach Excel as if it were 2005?
Was this article helpful?
React and share it with someone who might find it useful.
- Like 0
- Insightful 0
- Celebrate 0
- Love 0
- Thought-provoking 0
Prefer to have it ready?
More guides in Excel automation for office work