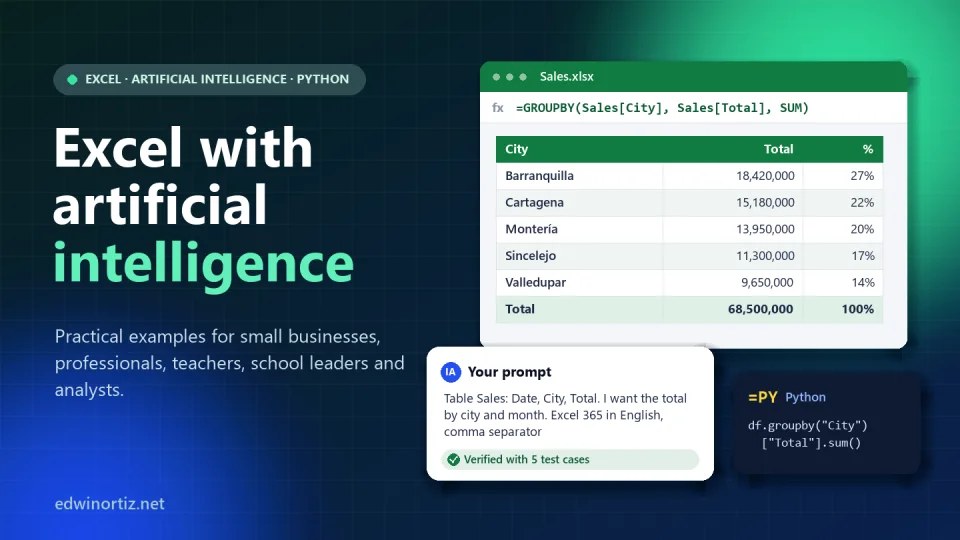
There is a scene that repeats itself in almost every office, principal’s office and staff room I know: someone opens a huge Excel file, sighs and says “artificial intelligence should be doing this.” They are half right. AI already writes in seconds formulas that used to cost an afternoon, explains a #VALUE! nobody understood and classifies a thousand comments in minutes. But it also invents functions that don’t exist, confidently sums the wrong column or receives, without anyone noticing, the personal data of five hundred students.
I have spent more than twenty years teaching math and technology in Colombia and building Excel templates for businesses and schools. What I have learned using AI with spreadsheets fits in one sentence: AI makes memorizing formulas less necessary, but it makes understanding your data more necessary. People who know what to ask, how their table is organized and how to check an answer get excellent results. Everyone else gets errors faster.
This guide is practical from start to finish: current tools, a prompt recipe, real formulas for small businesses, professionals, teachers and school leaders, an expert level with Python and, at the end, a gift so you can test it with your own files.
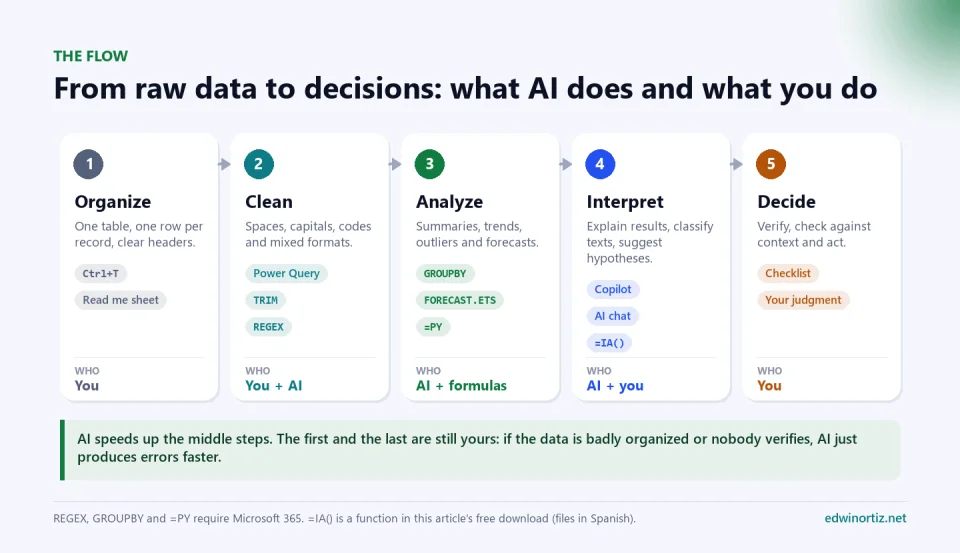
Before you ask AI anything: a workbook that can be helped
No assistant, however good, understands a workbook with merged cells, headers spread over three rows, totals mixed with data and a column that says “see note.” Before opening any chat, check these five rules; today they are worth twice as much, because AI reads your file the way a new colleague would.
- One table, one row per record. One sale, one student in one subject or one bank transaction per row. Turn the range into a table with Ctrl+T and give it a clear name, such as Sales or Grades.
- Unique headers and no merged cells. “Total” and “Date” tell AI what each column holds; “Column1” tells it nothing.
- Separate inputs, calculations and outputs. Rates, targets and scales go in their own cells or tables, not hidden inside a formula like
*0.19. If the sales tax changes, you change one cell, not two hundred. - One data type per column. If the date column contains text like “pending,” any analysis, human or artificial, breaks.
- Write the context down. A “Read me” sheet with the data source, the cut-off date and what each code means.
The map: which AI exists for Excel today and what you need to use it
The ecosystem changes every few months, so here is what I checked in Microsoft’s and Google’s official documentation in early October 2026.
| Tool | What it does | What you need |
|---|---|---|
| Copilot in Excel (pane and Agent Mode) | Creates formulas, PivotTables and charts, analyzes data and, in Agent Mode, runs multi-step tasks inside the workbook | Home: Microsoft 365 Personal, Family or Premium. Work: a Microsoft 365 Copilot license |
The =COPILOT() function | Was a function that called AI from a cell | Retired on September 14, 2026; cells that use it return #NAME? when they recalculate |
Python in Excel (=PY) | Runs pandas, charts and statistics inside a cell, in Microsoft’s cloud | Microsoft 365 business and enterprise (Windows, web and Mac); in preview for Personal and Family |
| Analyze Data | Suggests charts, trends and automatic summaries for a table | Excel for Microsoft 365, button on the Home tab |
| ChatGPT, Gemini or Claude | Write and explain formulas, macros, Power Query steps and Python code | Any version of Excel; be careful with what you paste |
| Modern functions | GROUPBY, PIVOTBY, LET, LAMBDA and the REGEX functions summarize and clean without AI | Excel for Microsoft 365 |
Three clarifications. Copilot’s Agent Mode has been generally available in Excel for the web since December 2025 and on Windows and Mac since January 2026, with a model picker for OpenAI and Anthropic models. Since April 15, 2026, in organizations with more than 2,000 Microsoft 365 seats, users without a Microsoft 365 Copilot license no longer see Copilot Chat inside Word, Excel and PowerPoint; smaller ones keep it with standard access, which may be limited at peak times. And the =COPILOT() function never left beta: if a workbook depends on it, it no longer recalculates.
What if your school or company has Excel 2019 or 2021 without Copilot? No problem: an external chat used well, plus classic formulas, takes you a long way. Almost every example in this guide includes an alternative for older versions.
The prompt recipe for Excel
Most bad answers come from poor questions. “Give me a formula to add up sales” forces AI to guess six things. This is the recipe I use, with six ingredients:
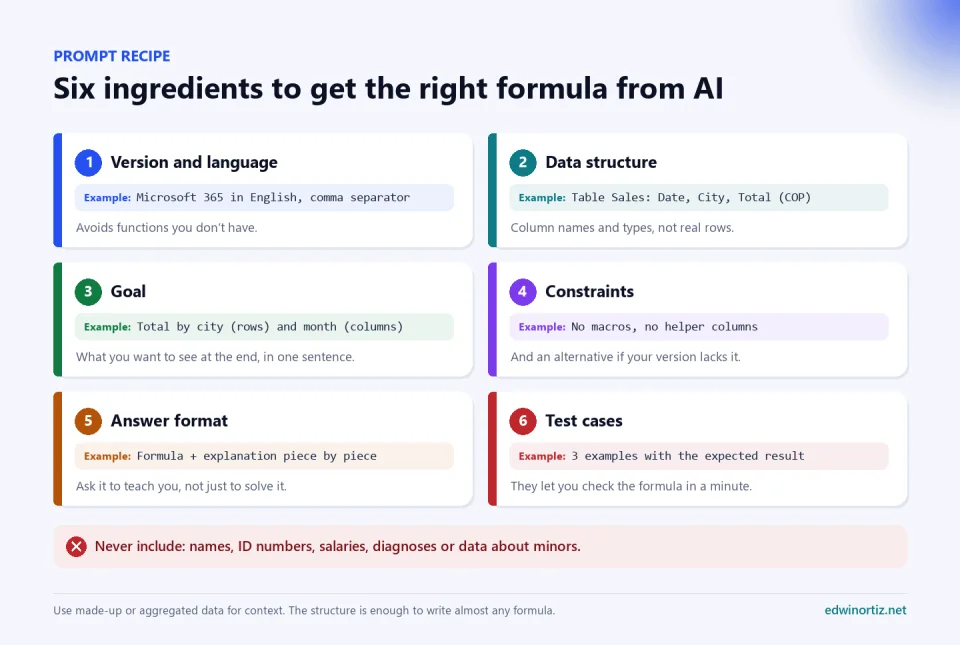
Act as an Excel expert. I use Microsoft 365 in English (comma separator).

DATA: a table named Sales, about 800 rows. Columns: Date (date),
City (text), Seller (text), Product (text), Category (text),
Units (integer), Unit price (COP), Total (COP), Channel (text).
Made-up example: 01/15/2026 | Monteria | Seller 3 | Ground coffee 500 g |
Food | 3 | 21900 | 65700 | WhatsApp

GOAL: a summary of sales by city (rows) and month (columns), with
totals, that updates itself when I add new sales.

CONSTRAINTS: no macros; no helper columns. If the ideal function doesn't
exist in Excel 2021, also give me a compatible alternative.

FORMAT: the formula in one block, an explanation piece by piece and
three test cases with the result I should get.
Notice what it does not include: a single real row. AI doesn’t need to see your customers’ data to write the formula; it needs the structure, the goal and the rules. Other prompts I use every day:
- To explain an error: “This formula returns #N/A in some rows: [formula]. Code is text in Customers and a number in Orders. Give me the likely cause and two fixes.”
- To audit a model: “I’ll describe the sheets and key formulas of my budget. Look for constants inside formulas, badly anchored references, ranges that don’t grow and circular references. Give me a table with finding, cell and risk.”
- To learn, not just copy: “Explain this formula as if I were your 11th-grade student, then give me a similar exercise to practice.”
Practical examples for small businesses and professionals
Sales by city and month, with and without the new functions
This is the summary shop owners ask me for most. In Microsoft 365, a single formula replaces the PivotTable and updates itself:
=PIVOTBY(Sales[City], TEXT(Sales[Date], "yyyy-mm"), Sales[Total], SUM)PIVOTBY takes what goes in rows, what goes in columns, the values and the function. If you only need a list by city, GROUPBY is even shorter, and you can ask for each city’s share of the total:
=GROUPBY(Sales[City], Sales[Total], SUM)
=GROUPBY(Sales[City], Sales[Total], PERCENTOF)
Excel 2019 or 2021? Type the cities in A2:A6 and the first day of each month in B1:M1, and use SUMIFS:
=SUMIFS(Sales[Total], Sales[City], $A2,
    Sales[Date], ">="&B$1, Sales[Date], "<="&EOMONTH(B$1, 0))
One detail: format codes and separators depend on your Excel language; in Spanish Excel the code is “aaaa-mm” and arguments are separated by semicolons. AI forgets this if you don’t tell it your language.
If you prefer good old PivotTables, which are still the fastest tool for exploring, in this video from my channel (in Spanish) I show you how to master them step by step:

Sales forecasting without advanced statistics
With 24 or more months of history, FORECAST.ETS projects the next month taking trend and seasonality into account. If the dates are in A2:A25, sales in B2:B25 and the month you want to project in A26:
=FORECAST.ETS(A26, $B$2:$B$25, $A$2:$A$25, 12)
=FORECAST.ETS.CONFINT(A26, $B$2:$B$25, $A$2:$A$25, 0.95, 12)
The second gives the margin of error at 95% confidence. Always show it: a forecast without a margin is a promise. The dates need a constant step, such as the first day of each month, and the function isn’t available in Excel for the web.
Inventory: when to reorder
In an inventory table with the columns Stock, Sold90 (units sold in the last 90 days), LeadDays and SafetyStock, LET lets you write the calculation the way a shopkeeper would say it:
=LET(demand, [@Sold90] / 90,
     reorder, demand * [@LeadDays] + [@SafetyStock],
     IF([@Stock] <= reorder, "Order", "OK"))
Change one row by hand to see whether the alert appears when it should. If you also manage fixed assets, my fixed-asset inventory label generator with QR and barcodes prints the labels from the same list.
Finance and accounting: models that can be audited
Banks in Colombia usually quote an effective annual rate, but the payment is calculated with the monthly rate. With the rate in B1, the term in months in B2 and the amount in B3:
Monthly rate (B4):    =(1 + B1)^(1/12) - 1
Fixed payment (B5):   =PMT(B4, B2, -B3)
Total interest:       =B5 * B2 - B3
Inputs, calculations and result go in different colors; that way anyone, AI included, understands the model. In this video from my channel (in Spanish) I explain the PMT function with a complete case:

For reconciliations, AI is great at proposing formulas with tolerance. This one looks in the bank statement for a transaction within 100 pesos and three days:
=FILTER(Bank[Reference],
    (ABS(Bank[Amount] - [@Amount]) <= 100) * (ABS(Bank[Date] - [@Date]) <= 3),
    "No match")
Careful: if two transactions meet the condition, it returns both. Did AI warn you? A formula is tested with the hard cases, not the easy ones.
Human resources: clean before you analyze
Staff lists arrive with double spaces, names in capitals and ID numbers with dots. Three formulas solve 80% of the problem:
Clean name:       =PROPER(TRIM(CLEAN(A2)))
Digits only:      =REGEXREPLACE(B2, "[^0-9]", "")
Valid mobile:     =REGEXEXTRACT(C2, "3\d{9}")
TRIM removes extra spaces and PROPER fixes capitalization. The Microsoft 365 REGEX functions, REGEXREPLACE and REGEXEXTRACT, work with patterns: the first keeps only the digits and the second extracts a ten-digit Colombian mobile number starting with 3. If the cleanup repeats every month, do it in Power Query (Data > Get Data), which saves the steps and repeats them with one click; AI writes those steps well if you describe the columns. And a golden rule for this area: names, ID numbers, salaries, sick leave and diagnoses never go into a chat.
Sales and customer service: classifying comments
Hundreds of survey comments can be classified in two ways. The deterministic one, with keywords, is free, instant and always gives the same result:
=IFS(
    REGEXTEST(A2, "late|delay|arriv", 1), "Delivery",
    REGEXTEST(A2, "price|expensive|cost", 1), "Price",
    REGEXTEST(A2, "service|kind|rude", 1), "Service",
    TRUE, "Other")
REGEXTEST returns TRUE if it finds the pattern; the final 1 ignores case. It works until someone writes “never buying from you again, a disgrace”: no keyword, and it is the comment that matters most. That is where a language model is worth it, because it understands intent; later you’ll see how to use one with the free download or with Python.
Examples for teachers and school leaders
Performance levels under Colombia’s Decree 1290
Colombia’s Decree 1290 of 2009 defines a national scale with four levels (Superior, High, Basic and Low), and each school sets the equivalent numeric ranges in its institutional assessment system (SIEE). That is why I don’t type the cut-offs inside the formula: I put them in a table named Scale, with the columns From and Level (for example 1.0 Low; 3.0 Basic; 4.0 High; 4.6 Superior) and use XLOOKUP with an approximate match to the next smaller value:
=XLOOKUP([@Grade], Scale[From], Scale[Level], "No grade", -1)If the academic council changes the ranges, you change the Scale table and the whole workbook updates. AI writes the formula; you know the ranges belong to the school.
Attendance
With one row per student and one column per day, marking P (present) or A (absent), the attendance rate and the alert are two formulas:
Attendance %:  =COUNTIF(C2:Z2, "P") / COUNTA(C2:Z2)
Alert:         =IF(AA2 < 0.8, "Review", "")
In this video from my channel (in Spanish) I show you, step by step, how to build an attendance list in Excel for students or employees:

And if you’d rather not build it, the work or school attendance list template is ready to use.
For school leaders: the summary you take to the committee
Coordinators and principals need the big picture without opening forty grade sheets. With all grades in a Grades table (Student code, Grade level, Class, Subject, Term, Grade, Absences), this formula counts how many students ended up in Low by class and subject in term 2:
=PIVOTBY(Grades[Class], Grades[Subject], Grades[Grade],
    LAMBDA(x, SUM(--(x < 3))), , , , , ,
    (Grades[Term] = 2) * (Grades[Grade] <> "") = 1)
And this one lists students at risk, defined as those with two or more subjects in Low in that term:
=LET(t, GROUPBY(HSTACK(Grades[Class], Grades[Student code]), Grades[Grade],
        LAMBDA(x, SUM(--(x < 3))), 0, 0, ,
        (Grades[Term] = 2) * (Grades[Grade] <> "") = 1),
     FILTER(t, CHOOSECOLS(t, 3) >= 2, "No students at risk"))
Why the Grades[Grade] <> "" filter? Because a pending grade, an empty cell, compares as zero, and the student would show up in Low without being there. AI doesn’t see that error unless you tell it there are pending grades; the profiling macro in the free download does. In Excel 2019 or 2021 use a helper column with COUNTIFS: =COUNTIFS(Grades[Student code], [@[Student code]], Grades[Grade], "<3", Grades[Term], 2). Cross it with absences and you have an evaluation and promotion committee driven by data, not impressions. Just remember: a risk list is an alert to talk with the student and their family, not a label.
For the part of teaching that doesn’t live in Excel I have two tools that work in Spanish: the AI Kit for Teachers, with tested prompt recipes by subject (Math and Technology and Computing fit this guide very well; I explain how I built them in this article), and the AI Exam Generator, with versions, an answer sheet and an answer key, which you can try for free in the simulator.
For data analysts: your own functions with LAMBDA
LAMBDA lets you create named functions without writing macros. In the Name Manager (Formulas > Name Manager) create the name LEVEL1290 with this definition:
=LAMBDA(grade, XLOOKUP(grade, Scale[From], Scale[Level], "No grade", -1))From then on, =LEVEL1290(B2) works across the whole workbook like any other function. You write the rule once, test it once and reuse it a hundred times. AI is a good partner for writing complex LAMBDAs, as long as you give it test cases.
Expert level: Excel and Python
Detecting outliers with a statistical criterion, fitting a regression or processing ten thousand texts with a language model is hard with formulas. That is what Python is for, and today you have two paths.
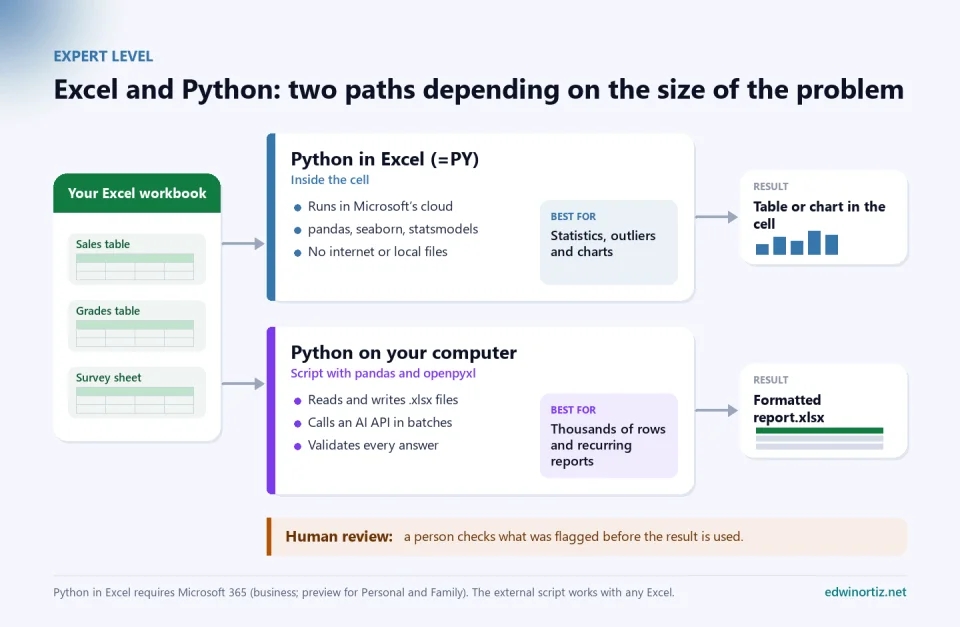
Path 1: Python in Excel
Type =PY in a cell, press Tab and the cell becomes a Python editor; confirm with Ctrl+Enter. The code runs in Microsoft’s cloud with an Anaconda distribution that already includes pandas, NumPy, Matplotlib, seaborn and statsmodels; it can’t read files on your computer or connect to the internet, and it reads the workbook with xl(). Select the range with the mouse and let Excel write the reference.
Sales by city and month, pandas style:
df = xl("Sales[#All]", headers=True)
df["Month"] = df["Date"].dt.to_period("M").astype(str)
df.pivot_table(index="City", columns="Month", values="Total",
               aggfunc="sum", fill_value=0)
Outlier sales using the interquartile range criterion:
df = xl("Sales[#All]", headers=True)
q1, q3 = df["Total"].quantile([0.25, 0.75])
iqr = q3 - q1
outliers = df[(df["Total"] < q1 - 1.5 * iqr) | (df["Total"] > q3 + 1.5 * iqr)]
outliers.sort_values("Total", ascending=False)
And for a school leader who wants to know how much absences weigh on the average, a simple regression. Notice the two cleaning lines: they convert grades typed as text (“3,5” with a decimal comma) and drop impossible ones (a 45 that should have been 4.5):
# Cell 1: average and absences per student, and the model
import statsmodels.formula.api as smf
grades = xl("Grades[#All]", headers=True)
grades["Grade"] = pd.to_numeric(grades["Grade"].astype(str).str.replace(",", "."), errors="coerce")
grades = grades[grades["Grade"].between(1, 5)]
res = grades.groupby("Student code").agg(Average=("Grade", "mean"),
                                         Absences=("Absences", "sum"))
model = smf.ols("Average ~ Absences", data=res).fit()
slope = model.params["Absences"]
f"Slope: {slope:.3f}  R²: {model.rsquared:.2f}"

# Cell 2, below the previous one: the chart
sns.regplot(data=res, x="Absences", y="Average")
The slope tells you how much the average drops for each absence and R² how much absences alone explain it. A relationship doesn’t prove causation; that conversation belongs to the teaching team. Python cells run in order, left to right and top to bottom, which is why the second can use res; to see a result as regular cells, switch the output to “Excel value” in the cell menu.
Path 2: Python outside Excel, with AI in batches
For thousands of rows, language-model calls or weekly reports, a script on your computer with pandas and openpyxl is the way to go. This is the skeleton I use to classify survey comments with Gemini and return a report in Excel. It reads the sample file from the free download, whose sheets and columns are in Spanish (Encuesta is the survey sheet and Comentario the comment column):
import os
import pandas as pd
from google import genai

client = genai.Client(api_key=os.environ["GEMINI_API_KEY"])
CATEGORIES = ["Atención", "Entrega", "Precio", "Calidad del producto", "Pagos"]

def classify(text: str) -> str:
    prompt = ("Classify the comment into ONE of these categories: "
              + ", ".join(CATEGORIES) + ". Answer with the category only.\n"
              + "Comment: " + text)
    r = client.models.generate_content(model="gemini-2.5-flash", contents=prompt)
    cat = (r.text or "").strip()
    return cat if cat in CATEGORIES else "Review"

df = pd.read_excel("datos-ejemplo.xlsx", sheet_name="Encuesta")
df["Category"] = [classify(t) for t in df["Comentario"].fillna("")]
summary = df["Category"].value_counts().rename_axis("Category").reset_index(name="Comments")

with pd.ExcelWriter("report.xlsx", engine="openpyxl") as w:
    summary.to_excel(w, sheet_name="Summary", index=False)
    df.to_excel(w, sheet_name="Detail", index=False)
    w.sheets["Detail"].freeze_panes = "A2"
Three design decisions matter more than the code: the answer is validated against the category list (if the model invents one, the row goes to “Review”), the comments carry no customer name or ID, and the result goes back to Excel, where a person reviews it. It works for analytics teams, quality departments reading customer complaints and schools analyzing their yearly self-assessment. To run it, install pip install pandas openpyxl google-genai; the full script in the free download goes further: it cleans the data with a change log, computes KPIs, detects outliers, forecasts six months, classifies in cached batches and writes a report with charts.
Privacy: what you should never paste into a chat
In Colombia, Law 1581 of 2012 protects personal data, gives special treatment to sensitive data such as health information and requires respecting the best interests of children and adolescents; most countries have similar rules. Pasting a list of students with their diagnoses into a free chatbot isn’t a shortcut: it is a problem. The terms of the free Gemini API say Google may use what you send to improve its products, that human reviewers may read it, and they expressly ask you not to submit sensitive, confidential or personal information. On paid services, Google doesn’t use your prompts to improve its products.
- Share the structure, not the records. Column names, data types and two made-up rows are enough to write almost any formula.
- Anonymize when you need real data. Replace names with codes (
="STU-"&TEXT(ROW()-1, "000")) and keep the lookup table only on your own computer. - Aggregate before sharing. “Class 9B: 12 students in Low in Math” is useful to AI and identifies no one.
- Use your organization’s accounts. Business versions usually protect data better than free accounts.
How to verify a formula AI gave you
AI writes formulas with a confidence it doesn’t always deserve. Before using one in a report someone is going to sign, run it through this list:
- Understand it. If you can’t explain it, don’t use it. Press F9 on parts of the formula or use Formulas > Evaluate Formula.
- Test it with small data calculated by hand. Five rows whose result you know in advance.
- Look for the edges. Empty cells, text where a number goes, zeros, dates on the last day of the month, accents and capitals, repeated values.
- Add a row and copy the formula. Does the range grow? Are the $ signs where they should be?
- Compare it with another method. A PivotTable, a filter or a calculator should give the same result.
- Check your version. GROUPBY or REGEXREPLACE don’t exist in Excel 2019: whoever receives your file will see #NAME?.
- Check language and separators. Function names and argument separators change with Excel’s language and regional settings.
- Reconcile the totals. The sum of the summary must equal the sum of the data.
- Document it. A note with what it does, who reviewed it and when.
A trick that has saved me several times: ask the same AI to write the test cases before the formula. If the cases are wrong, the formula will be too.
When not to use AI
Not every Excel problem is an AI problem. If the task follows fixed rules and repeats every week, a macro, Power Query or a good template is cheaper, faster and always gives the same result. AI shines when it has to understand language, explore or write the code for the first time; automation shines when something has to be repeated.
| Task | Best option |
|---|---|
| Send 300 personalized emails, each with its attachment | A macro (AI can help you write it once) |
| Generate certificates or letters as PDFs from a list | Mail merge |
| Combine and clean the same report every month | Power Query |
| Classify open-ended comments or summarize texts | AI with human review |
| Write a formula you don’t know how to build | AI plus verification |
| Explore a new dataset looking for patterns | Analyze Data, Copilot or Python |
That is why my templates for repetitive tasks don’t use AI: send bulk emails with attachments and CC and BCC copies, mail merge to individual PDFs, the bulk QR code generator and the invoice with email delivery to the customer. In this video from my channel (in Spanish) I show how bulk emails with different attachments work from Excel and Outlook:

And if you only need one specific function, the free number to words and QR code generator tools come with their own Excel modules to download at no cost. You can browse every template in the Excel and automation section.
Your reward for reading this far: AI macros for Excel
If you read all the way here, you deserve more than theory. I prepared a free package so you can test what you just read with your own files:
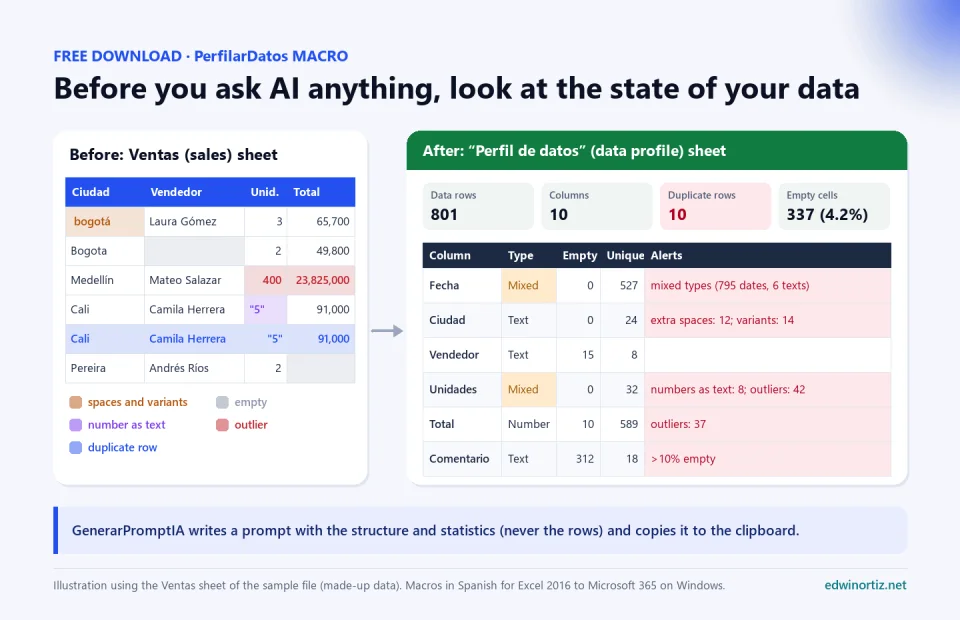
Free download: Excel with AI. The ExcelConIA.bas macro module for Excel 2016 to Microsoft 365 on Windows, a workbook of made-up data (Ventas, Notas and Encuesta sheets: sales, grades and a survey, with errors placed on purpose for practice), a Python script that runs the complete analysis and an installation guide. No sign-up, no cost. Please note that the macros, messages, sample data and guide are in Spanish.
- PerfilarDatos (profile data): click inside your table and it creates a “Perfil de datos” sheet with each column’s type, empty cells, unique values and statistics, plus alerts for mixed types, numbers stored as text, extra spaces, outliers and duplicate rows.
- GenerarPromptIA (generate AI prompt): asks what you want to achieve and builds a prompt with the table’s structure and statistics, never its rows, that asks for cleaning steps, five analysis questions, formulas for your version of Excel and pandas code. It lands on your clipboard, ready to paste into ChatGPT, Gemini, Copilot or Claude.
- AI functions:
=IA("Summarize in 10 words", A2),=IA_CLASIFICAR(B2, $H$2:$H$6)(classify) and=IA_EXTRAER(C2, "email")(extract) call Google Gemini with your own free Google AI Studio key, which you save with the ConfigurarIA macro. Answers are cached in memory so queries aren’t repeated, and LimpiarCacheIA clears them.
To install it: unblock the .zip (right-click > Properties > Unblock), extract it, press Alt+F11, File > Import File, choose ExcelConIA.bas and save your workbook as .xlsm. PerfilarDatos and GenerarPromptIA run only on your computer, with no internet or key; the AI functions send the text of the cells you use to Google and need Windows, so use them with anonymized data. To try this article’s formulas on the sample workbook, turn each sheet into a table with Ctrl+T and give it the sheet’s name (columns keep their Spanish names).
Download the complete package (.zip) Download only the ExcelConIA module (.zip)
To use the macros you need the Developer tab. If you don’t see it in your Excel, in this short video from my channel (in Spanish) I show you how to turn it on:

You’ll find many more tutorials in my Excel playlist on YouTube, all in Spanish: formulas from scratch, macros, forms, charts, QR codes and invoices.
Did this guide help you? Tell me in the “Was this article helpful?” section just below: your reaction helps me decide which examples to expand. And if you know someone who is always fighting with Excel, send them the link; it will probably save them a few hours.
Frequently asked questions
Do I need Copilot to use AI with Excel?
No. Copilot is convenient because it works inside the workbook, but any AI chat can write and explain formulas, macros and Power Query steps for any version of Excel. What you do need is to describe your data well and verify the answers.
What happened to the =COPILOT() function?
It was a beta function for the Insider and Frontier programs, and Microsoft retired it on September 14, 2026. Results already calculated stay in the file, but when the cell recalculates it shows #NAME?. Microsoft recommends doing those tasks from the Copilot pane.
Does Python in Excel replace formulas?
No. Formulas are still the best choice for calculations others must read and audit. Python in Excel is worth it for statistics, outliers, regressions and advanced charts, and it needs an internet connection because it runs in Microsoft’s cloud.
Do these formulas work in Excel in other languages?
Yes. Excel translates function names when it opens the file. If you copy a formula as text, change the names (SUMIFS is SUMAR.SI.CONJUNTO in Spanish) and the separators to match your settings.
A question to close
For years, knowing Excel meant knowing a lot of formulas. Today anyone can ask AI for the perfect formula in seconds. What they can’t ask it for is knowing what to ask, recognizing when a result makes no sense or deciding what to do with what the data shows. If AI already writes the formulas, which part of your work with Excel is the one that really matters, and how much time are you giving it?
Was this article helpful?
React and share it with someone who might find it useful.
- Like 0
- Insightful 0
- Celebrate 0
- Love 0
- Thought-provoking 0
Prefer to have it ready?
More guides in Excel automation for office work