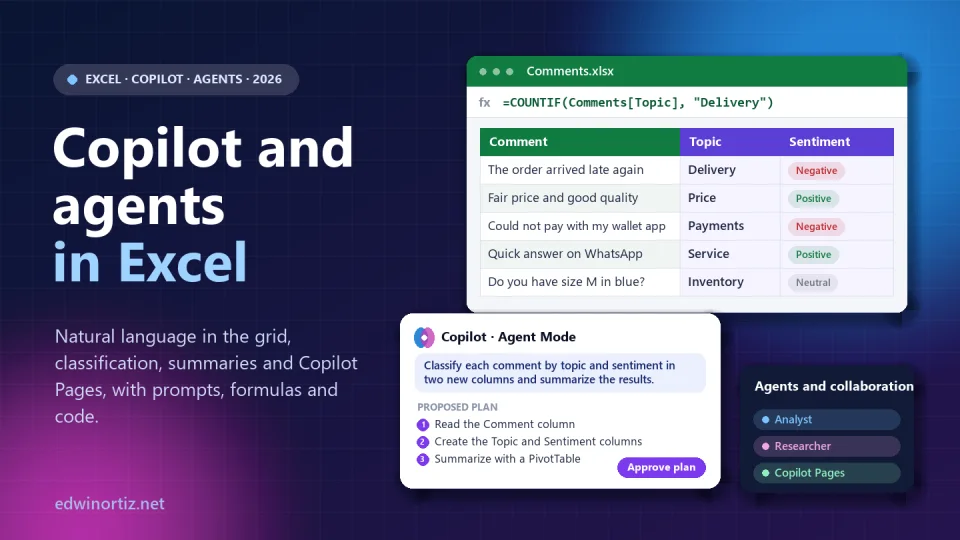
A year ago the promise sounded perfect: type =COPILOT("Classify this comment", B2) in a cell, fill it down and watch artificial intelligence complete a thousand rows. Many colleagues wrote to me, excited. Today that function no longer exists, not because the idea was bad, but because Microsoft decided to put natural language somewhere else: a Copilot pane that no longer just answers, but plans, edits the workbook, creates columns, formulas and PivotTables, and works with agents.
In this guide I explain, with sources checked on October 8, 2026, what Excel offers today, how to ask Copilot to classify and summarize, which agents exist and what Copilot Pages is for. Above all, I give you exact prompts, formulas and code for small businesses, accountants, HR, teachers, school leaders and analysts, because a tool that is never tested on a real case is just news.
What Excel offers today (October 2026)
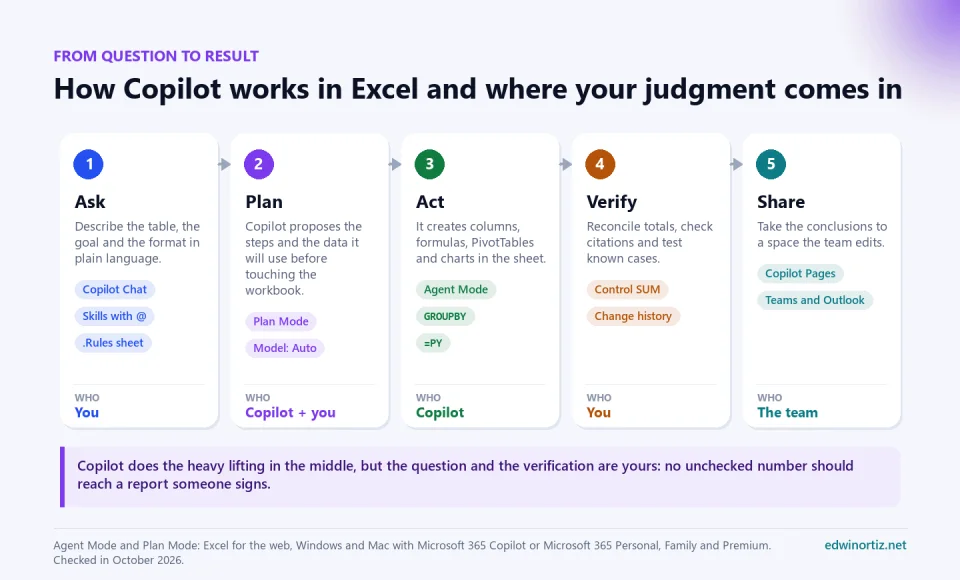
Microsoft changes names and buttons almost every month, so let me start with the map. This is what is current, with its source:
| Feature | What it does | Status |
|---|---|---|
| Copilot Chat in Excel | Answers questions, explains formulas and summarizes data without changing the workbook | Available in the Copilot pane |
| Agent Mode | Edits the workbook in several steps: columns, formulas, PivotTables, charts | Generally available since January 2026; the default since April |
| Plan Mode | Shows the steps and data it will use before touching the sheet | Generally available since May 2026 |
| Model choice | Auto, or OpenAI and Anthropic models you pick | Available; Grok through the Frontier program |
| Personalization and workbook rules | Your standing instructions, or a .Rules sheet that travels with the file | Available since June 2026 |
| Change history with Copilot | Explains what changed, who changed it and undoes specific edits | Available since September 1, 2026 |
The =COPILOT() function | Called AI from a cell | Retired on September 14, 2026 |
The details: Agent Mode reached Excel for the web in December 2025 and Windows on January 27, 2026, with a switcher between OpenAI and Anthropic models, according to the official Excel blog. On April 22, 2026, Microsoft announced that these capabilities became the default experience in Word, Excel and PowerPoint for Microsoft 365 Copilot, Premium, Personal and Family. Plan Mode launched in May, and July added GPT-5.6 and Claude Opus 5, plus support for workbooks with AutoSave turned off on Windows and Mac. Since February, Agent Mode also works with files saved on your computer.
What happened to =COPILOT(), and how do you do the same today?
Microsoft’s support page is clear: since September 14, 2026 the function is no longer available; results that were already calculated stay as cached values, but when the cell recalculates it shows #NAME?. It never left the Insider and Frontier preview. Microsoft recommends the Copilot pane, which summarizes text, classifies data, generates content and looks things up on the web.
If you have a workbook that uses it, do this before anyone presses F9: copy the column, paste it as values and leave a note with the date and the prompt that was used. Then redo the task like this:
Before (retired beta):
=COPILOT("Classify as Delivery, Price, Payments, Service or Inventory", B2)

Now, in the Copilot pane with Agent Mode:
In the Comments table add a Topic column that classifies each comment
into ONE of these categories: Delivery, Price, Payments, Service,
Inventory or Other. Add a Sentiment column with Positive, Neutral or
Negative. Do not change the Comment column. Show me the plan first.
Finally, on a new sheet, create a PivotTable counting Topic by Sentiment.
The underlying difference matters: the function recalculated and could change its answer; Agent Mode writes the result into the sheet as data you can audit, filter and compare. For long text, Microsoft also documents how to get themes, sentiment and summaries from a text column, with numbered citations pointing to the source rows.
Classify and summarize in plain language: three prompts and what to expect
Imagine a Comments table with 1,200 answers from a store’s customers. These are the prompts I use, in order:
1) Explore (Copilot Chat, no edits):
What are the five most frequent topics in Comments[Comment]? For each
one, give me a verbatim example and the approximate number of rows.

2) Classify (Agent Mode):
Using those five topics plus "Other", add the Topic column. If a
comment touches two topics, pick the main one and write the second in
a Topic2 column. Mark the ones you don't understand as "Review".

3) Summarize to decide:
On the Summary sheet write three findings with their figure, citing
the range each number comes from, and two concrete actions for the month.
The expected output is a Topic column with values such as Delivery, Payments or Other; a PivotTable with, say, 412 Delivery comments, 318 of them negative; and a paragraph like “34% of comments mention late deliveries, concentrated in weekend orders.” Now comes what separates a professional from an amateur: checking. These formulas don’t depend on AI:
Unclassified rows:        =COUNTBLANK(Comments[Topic])
Invented categories:      =SUM(--ISNA(XMATCH(Comments[Topic], Categories[Topic])))
Reconcile with PivotTable: =ROWS(Comments) - Summary!B10   (B10: grand total)
Sample of 20 to read:     =TAKE(SORTBY(Comments, RANDARRAY(ROWS(Comments))), 20)
If the second formula isn’t zero, Copilot created a category you didn’t ask for; if the third isn’t zero, the PivotTable doesn’t cover every row. And reading twenty random comments with their label tells you in five minutes whether the classification makes sense.
No Copilot? For categories with stable keywords, a classic formula is free, instant and always gives the same result. With a Keywords table (Keyword and Topic columns):
=LET(t, LOWER([@Comment]),
     hit, ISNUMBER(SEARCH(Keywords[Keyword], t)),
     IFERROR(INDEX(FILTER(Keywords[Topic], hit), 1), "Review"))
It works in Microsoft 365 and Excel 2021 (LET, FILTER). AI is then reserved for what truly requires understanding language: irony, mixed complaints, comments without keywords.
Before you ask: rules Copilot always follows
Since June 2026 you can write your preferences once. Personalization stores your rules for every workbook, and workbook rules live in a sheet whose name ends in .Rules, one rule per row in column A. This is the one I put in my templates:
Sheet: Template.Rules (column A)
Never merge cells; use "Center Across Selection".
Write formulas with structured table references, not fixed ranges.
Do not paste values where a formula belongs.
Currency format: $#,##0 with no decimals.
Every summary sheet has a "Control" cell that compares its total with
the total of the source table.
Never write student or employee names: use the ID code.
Because the sheet travels with the file, everyone who uses Copilot in that workbook follows the same rules. For a school or a small business with several people editing, that is gold.
Step-by-step practical scenarios
Small businesses: sales and inventory
A store with a Sales table (Date, Product, Category, Units, Total) and an Inventory table (Product, Stock, Cost). This is an outcome-based prompt, as Microsoft recommends:
Use the Sales and Inventory tables. Show me the plan first. Then:
1) Create a Summary sheet with total sales by category and month,
   using formulas (no pasted values).
2) In Inventory add "Days of stock" based on average daily sales over
   the last 90 days.
3) Highlight in red the products with fewer than 15 days.
4) Add a Control cell comparing the summary total with SUM(Sales[Total]);
   it must be 0.
What you should see in the sheet, and what you must review formula by formula:
Summary (A3):
=PIVOTBY(Sales[Category], TEXT(Sales[Date], "yyyy-mm"), Sales[Total], SUM)

Days of stock (column in Inventory):
=LET(avg, SUMIFS(Sales[Units], Sales[Product], [@Product],
                 Sales[Date], ">=" & TODAY() - 90) / 90,
     IF(avg = 0, "No sales", ROUND([@Stock] / avg, 0)))

Control:
=SUM(Sales[Total]) - TAKE(A3#, -1, -1)
If the control isn’t zero, don’t present the report. And once the analysis tells you which products move, the next step is usually operational: labeling stock with the fixed asset label generator with QR and barcodes or invoicing with the invoice template that emails the customer. That needs no AI: it needs a template that never fails.
Finance and accounting: bank reconciliation
With Bank and Ledger tables, the prompt:
Reconcile Bank against Ledger by Reference and Amount. Add a Status
column to Bank with Matched, Pending or Duplicate in ledger. Use
formulas, not values. Then explain the 10 largest pending items and
what pattern you see (dates, counterparties, fees). Do not delete or
change any original row.
The formula you should find in the Status column, easy to audit:
=LET(n, COUNTIFS(Ledger[Reference], [@Reference], Ledger[Amount], [@Amount]),
     IF(n = 1, "Matched", IF(n = 0, "Pending", "Duplicate in ledger")))

Pending amount: =SUMIF(Bank[Status], "Pending", Bank[Amount])
If the reconciliation repeats every month, turn it into a button. This Office Script (TypeScript, Automate tab in Excel for the web and Windows, with a work or school account) highlights unmatched items and counts them:
function main(workbook: ExcelScript.Workbook) {
  const bank = workbook.getTable("Bank");
  const ledger = workbook.getTable("Ledger");
  const key = (r: (string | number | boolean)[], iRef: number, iAmt: number) =>
    `${String(r[iRef]).trim()}|${Number(r[iAmt]).toFixed(2)}`;

  const lh = ledger.getHeaderRowRange().getValues()[0] as string[];
  const inLedger = new Set(ledger.getRangeBetweenHeaderAndTotal().getValues()
    .map(r => key(r, lh.indexOf("Reference"), lh.indexOf("Amount"))));

  const bh = bank.getHeaderRowRange().getValues()[0] as string[];
  const body = bank.getRangeBetweenHeaderAndTotal();
  body.getFormat().getFill().clear();
  let pending = 0;
  body.getValues().forEach((row, i) => {
    if (!inLedger.has(key(row, bh.indexOf("Reference"), bh.indexOf("Amount")))) {
      body.getRow(i).getFormat().getFill().setColor("#FFF2CC");
      pending++;
    }
  });
  console.log(`Bank items without a match: ${pending}`);
}
And when several people touch the same workbook, the change history skill answers questions like “what changed on this sheet since Monday and who did it?” or “undo only last week’s Copilot edits and keep the manual ones.” In accounting, that traceability is worth as much as the reconciliation itself.
HR: absenteeism and exit interviews
The golden rule here is privacy: work with ID codes, not names or diagnoses. A useful prompt for the text column of exit interviews:
In ExitInterviews[Reason] identify the reasons for leaving and group
them into at most six categories. Add a Category column and a table
counting Department by Category. Do not use or show the ID column in
the summary. Flag any department with fewer than five cases, so we
don't publish figures that identify people.
For the absenteeism rate by department, a single formula:
=LET(a, GROUPBY(Staff[Department],
            HSTACK(Staff[Hours absent], Staff[Scheduled hours]), SUM, 0, 0),
     HSTACK(INDEX(a,, 1), INDEX(a,, 2) / INDEX(a,, 3)))
And if you then have to send each employee their certificate or pay stub, that is automation work, not AI: mail merge to individual PDFs and bulk emails with attachments do it in minutes.
Teachers and school leaders: grades, attendance and reports
With a Grades table (ID, Class, Subject, Grade) and your school’s Scale table, the performance level is a formula, not AI:
Level:  =XLOOKUP([@Grade], Scale[From], Scale[Level], "No grade", -1)

Students at risk (Low in 2 or more subjects or absences above 15%):
=FILTER(Summary[ID], (Summary[Subjects at Low] >= 2) + (Summary[% absences] > 0.15), "Nobody at risk")
Where Copilot does help is the report. This prompt saves me an afternoon before every grading committee:
Using the Summary table (student ID codes, never names) write for each
class a paragraph of at most 80 words for the grading committee:
number of students at Low by subject, relation to absences and one
concrete teaching action. Cite the cell or range of every figure.
Make no judgments about families or diagnoses.
A reminder that is not optional: children’s data has reinforced protection in most countries; in Colombia, for example, article 7 of Law 1581 of 2012. Use your school account, codes instead of names, and aggregate before sharing. If you track attendance in Excel, my attendance list template already has the calculations. For classroom work with AI, I built the AI Kit for Teachers with tested prompts by subject, the AI exam generator (try the demo) and PIAR with AI for individual accommodation plans (these tools are in Spanish).
Data analysts: Python in Excel plus Copilot
Python in Excel is available for business accounts on Windows and the web, and in preview for Personal and Family. Two =PY cells I use as a starting point:
# =PY cell 1: outliers in Total using the interquartile range
df = xl("Sales[#All]", headers=True)
q1, q3 = df["Total"].quantile([0.25, 0.75])
limit = q3 + 1.5 * (q3 - q1)
df[df["Total"] > limit].sort_values("Total", ascending=False)

# =PY cell 2: monthly trend and three-month projection
import numpy as np
df["Month"] = pd.to_datetime(df["Date"]).dt.to_period("M").astype(str)
m = df.groupby("Month")["Total"].sum()
x = np.arange(len(m))
slope, intercept = np.polyfit(x, m.values, 1)
pd.DataFrame({"Month": [f"+{i}" for i in (1, 2, 3)],
              "Projection": [round(intercept + slope * (len(m) - 1 + i)) for i in (1, 2, 3)]})
Since August, Insiders can ask Copilot to write those cells with the Python skill: “@python-in-excel detect outliers in Sales[Total] by category with the IQR method and explain the code line by line.” Note that, according to Microsoft support, @ skills currently work only when Office is in English. For analysis across several files, the Analyst agent, covered next, writes and runs Python and shows you the code; that transparency is what lets you audit it.
The agents: who is who
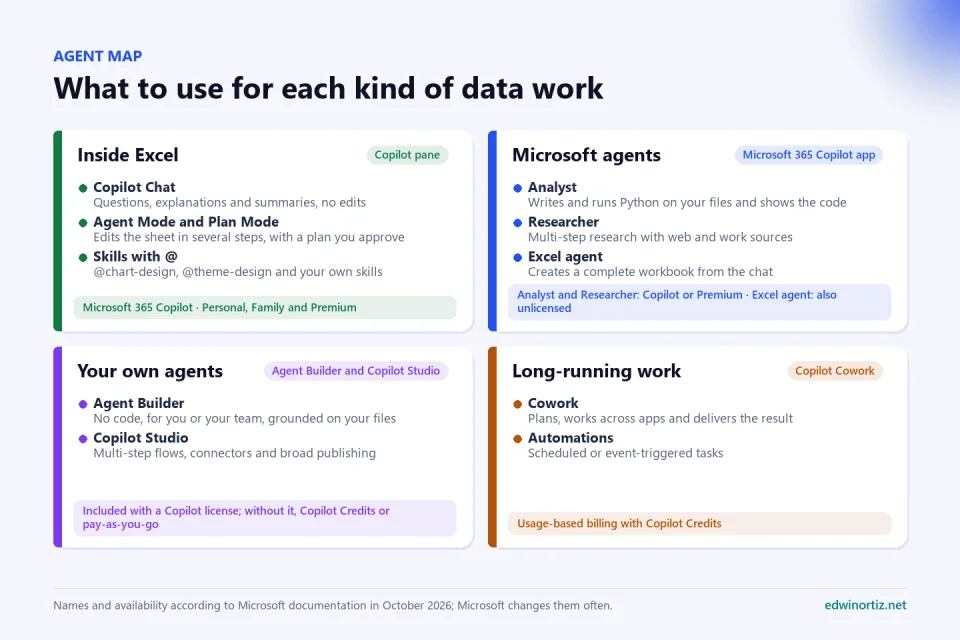
- Analyst plans the analysis, writes and runs Python, cleans data and returns charts and commentary from files you attach (Microsoft guide). Sample prompt: “I’m attaching Sales_2025.xlsx and Inventory.csv. Compare turnover by category and quarter, identify the ten products with the most days of stock and show me the code you used.”
- Researcher does multi-step research with web and work sources. Both launched for business customers in June 2025, then with 25 combined queries per month; check the current limits for your plan.
- The Excel agent in the Microsoft 365 Copilot app creates a complete workbook from the chat; according to support, people without a Copilot license can use it too, with web information and files they reference.
- Agent Builder and Copilot Studio create your own agents. Microsoft Learn sums it up: Agent Builder for simple no-code agents for you or your team; Copilot Studio for multi-step flows, connectors and broad publishing. Without a Copilot license they run on Copilot Credits or pay-as-you-go, and Agent Builder is free if the agent only uses web knowledge.
- Copilot Cowork, generally available since June 2026, runs long tasks across apps with usage-based billing.
These are the instructions of an agent I set up with Agent Builder for a grading committee; copy and adapt them:
Name: Grading committee assistant
Knowledge: "Committee 2026" folder (assessment policy, minutes and grade books with ID codes)

Instructions:
- Answer only from the files in the folder. If a fact is not there,
  say so; never estimate it.
- Never show names, ID numbers or health data: always use the
  student code.
- Every figure must state the file, sheet and range it comes from.
- Suggest concrete teaching actions and mark which ones need a
  committee decision.
- Respectful tone, with no judgments about families.

Conversation starters:
- "Summarize the Low cases in grade 9 for term 3"
- "What does our assessment policy say about make-up activities?"
Copilot Pages: from analysis to a team document
Copilot Pages turns a Copilot answer into a persistent page you edit, share and refine with your team and with Copilot. You create one with Edit in Pages from a response’s menu, or from the chat’s + button, under More, with the option to draft a page. With a work account, anyone with OneDrive or SharePoint storage can use it, even without a Copilot license; with a personal account, Personal, Family, Premium or Pro subscribers. It supports interactive charts, and the team can co-edit without entering your chat. One caveat from Microsoft itself: when several people edit at once, Copilot’s answer may not reflect every change until you refresh the page.
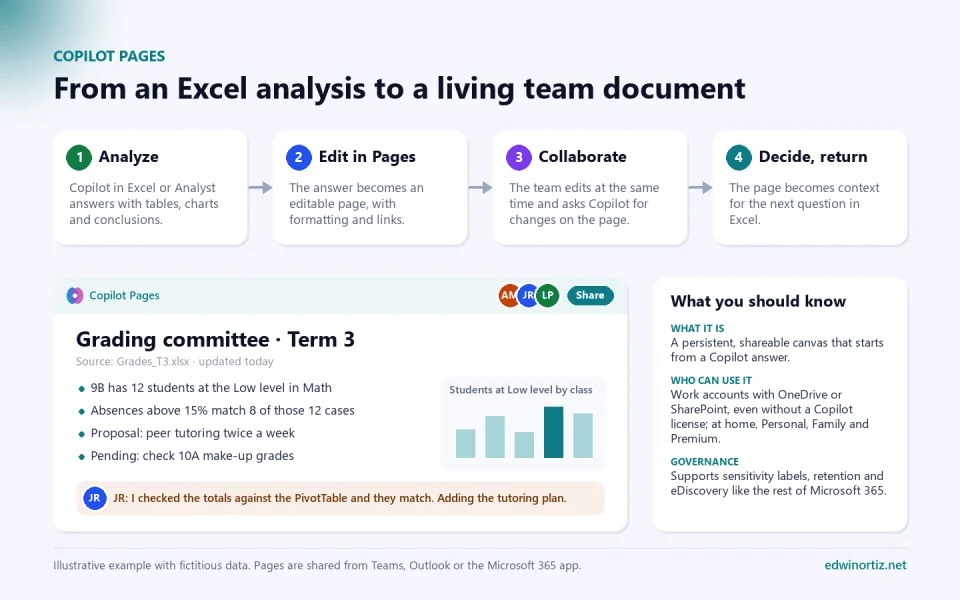
This is how I use it with an Excel analysis: Analyst or Copilot in Excel produce the summary; I move it to Pages; the coordinator adds the tutoring plan; a teacher checks the totals against the PivotTable and leaves a comment; and since June 2026 I can attach Loop pages as context in Copilot in Excel for the next question. The page becomes the living record of the decision, not one more email nobody can find.
Prompt inside the page:
Turn these findings into a table with Class, Finding, Figure, Source
(file and range), Action and Owner columns. Leave Owner empty so the
committee can fill it in.
Licensing: what you need in each case
| Your situation | Copilot inside Excel | Agents and Pages |
|---|---|---|
| Microsoft 365 Personal or Family | Yes, with monthly AI credits and only for the subscription owner | Pages, yes |
| Microsoft 365 Premium (US$19.99 a month in the US) | Yes, with the highest limits | Researcher, Analyst and Pages |
| Organization with a Microsoft 365 Copilot license | Full: Agent Mode, models, chat history, Work IQ | All of them, plus Agent Builder and Copilot Studio |
| Unlicensed, organization with more than 2,000 seats | No, since April 15, 2026 | Copilot Chat on the web, Word, Excel and PowerPoint agents, Pages |
| Unlicensed, organization with up to 2,000 seats | Copilot Chat with standard access, subject to capacity | Same as the previous row |
Sources: Copilot FAQ for home plans, the Microsoft 365 Premium announcement and the change for unlicensed users announced in messages MC1253858 and MC1253863, summarized by Kurt Shintaku. In Family, although the plan covers six people, AI features belong to the owner only. In organizations, Analyst and Researcher require the Microsoft 365 Copilot license. You will also see a name change: Microsoft Learn documentation already calls Microsoft 365 Copilot Microsoft Copilot and Copilot Chat Microsoft Copilot Chat; both names coexist during the transition.
Privacy and governance: what every leader should know
- Enterprise data protection. With a work account, prompts and responses fall under Microsoft’s Data Protection Addendum and aren’t used to train foundation models. Copilot respects permissions, sensitivity labels, retention and auditing.
- Sensitivity labels. If an encrypted file lets you view but not copy (the EXTRACT right), you won’t be able to use Copilot with it. It is a simple way to protect payroll or medical records.
- Anthropic models. In business accounts, the admin must enable them; Anthropic acts as a subprocessor, and its models are currently excluded from the EU Data Boundary.
- Web searches. Queries Copilot sends to Bing leave without user or tenant identifiers, but they are governed by terms different from Microsoft 365’s.
Limitations and how to verify
Copilot is very good at writing formulas and building tables, but it can confidently invent a figure in a summary. Microsoft says so in its own documentation: review, edit and verify anything Copilot creates. My minimum checklist before signing:
- Require formulas, not pasted values, and open at least three to read them.
- Add a control cell comparing each summary with the sum of its source; it must be 0.
- Hover over the numbered citations and check they point to the right rows.
- Read a random sample of what Copilot classified.
- Use Plan Mode for big tasks and don’t approve a plan you don’t understand.
- After several edits, ask the change history what changed.
- If the result goes to someone with Excel 2019 or 2021, check it doesn’t use functions their version lacks.
No Copilot? Free alternatives
If your school or company has no license, ChatGPT, Gemini or Claude write and explain formulas for any Excel version; the key is to describe the structure and never paste personal data. I explained it in detail in Excel with artificial intelligence: practical examples, where I also give away the ExcelConIA module: the PerfilarDatos macro profiles your table, GenerarPromptIA builds a prompt without personal data and the =IA_CLASIFICAR(B2, $H$2:$H$6) function classifies from a cell with your own free Google Gemini key. In practice, it brings back the convenience of the retired function in any Windows Excel. You can download the full package for free, and for single tasks there are the free number to words and QR code tools.
Take it to your work. AI helps you analyze; the tasks you repeat every week deserve a template that always does the same thing. In the Excel and automation section you will find bulk emails with attachments, mail merge to PDF, the bulk QR code generator and the invoice that emails the customer. If you teach, start with the AI Kit for Teachers and the exam generator.
Frequently asked questions
Can I still type natural language “inside the cell”?
Not with =COPILOT(), which was retired. Today you do it from the Copilot pane: Agent Mode writes columns, formulas and PivotTables into the sheet as auditable data. If you need a cell function, one alternative is the =IA() function in the free ExcelConIA module, with your own key.
Does Copilot replace formulas?
No. Copilot writes them for you, but the reliable result is still a formula someone can read. That’s why I always ask for formulas instead of values and a control cell.
Which model should I pick?
Start with Auto. If a complex task goes wrong, repeat it with another model and compare: that comparison is a cheap way to catch errors.
Food for thought
For decades, the most important moment in working with data was that awkward silence when someone looked at a figure and said “this can’t be right.” Today one click on “Approve plan” is enough for an agent to classify, summarize and suggest which students go to make-up classes or which supplier to stop buying from. If that click becomes routine, who answers when the agent is wrong: the person who approved without reading, the institution that asked for speed, or the company that designed the model? And are we willing to measure productivity by how many plans we approve, or by how many times we stopped to doubt?
Was this article helpful?
React and share it with someone who might find it useful.
- Like 0
- Insightful 0
- Celebrate 0
- Love 0
- Thought-provoking 0
Prefer to have it ready?
More guides in Excel automation for office work