Forecasting sales, enrollments or consumption sounds like a task for specialists, but Excel comes with functions and tools that do it in a few clicks. The problem is that a forecast always produces a number, and a well-presented number inspires confidence even when the method is unsuitable. The important question is not "what does Excel say?" but "how do I know whether I can believe it?".
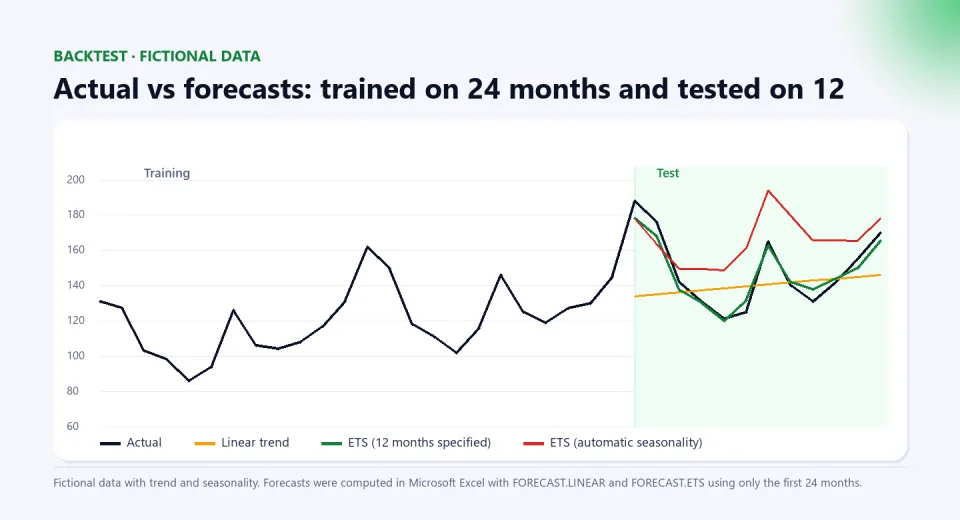
In this article I do something uncommon in this kind of text: a backtest. I train four methods on 24 months of fictional data, forecast the next 12 months and compare with what "actually happened". The results come from Microsoft Excel (version 16, es-CO regional settings) and the exercise workbook with solutions (in Spanish) is downloadable. Verified on October 9, 2026.
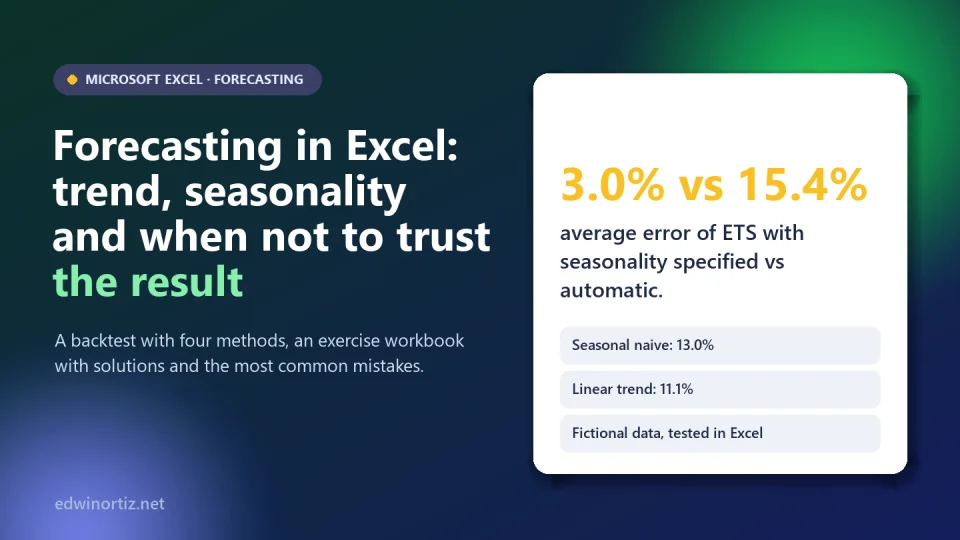
Summary. In the test, the ETS forecast with seasonality specified (12 months) had a mean error of 3.0%; the linear trend, 11.1%; the seasonal naive method, 13.0%; and the same ETS with seasonality auto-detected, 15.4%. The lesson: trend and seasonality matter, automatic mode does not always get it right, and no forecast is accepted without testing it on data it did not learn from. The data are fictional: the result illustrates the method, it is not a general rule.
Trend and seasonality: what we are talking about
- Trend: where the series is heading in the long run (up, down, flat).
- Seasonality: a pattern that repeats every cycle; for example, a school's uniform sales that rise in January-February and in July, when terms start.
- Noise: random variation that no method explains.
The test data are fictional monthly uniform sales over three years (2022 to 2024), generated with a rising trend, peaks in January, February and July, and some noise. I train on 2022-2023 and forecast 2024.
The four methods
- Seasonal naive: forecasts each month with the value of the same month last year. It is the simplest method and the minimum bar: if a complex method does not beat it, it is not worth it.
- Linear trend (
FORECAST.LINEAR;PRONOSTICO.LINEALin Spanish): draws a straight line through the data. It ignores seasonality. - ETS with seasonality specified (
FORECAST.ETSwith 12 as the seasonality): triple exponential smoothing, which models level, trend and seasonality. - ETS with automatic seasonality: the same function without stating the cycle, so Excel detects it.
' In English
=FORECAST.LINEAR(A28, B$4:B$27, A$4:A$27)
=FORECAST.ETS(A28, B$4:B$27, A$4:A$27, 12)
=FORECAST.ETS(A28, B$4:B$27, A$4:A$27)
=FORECAST.ETS.SEASONALITY(B$4:B$27, A$4:A$27)

' In Spanish
=PRONOSTICO.LINEAL(A28; B$4:B$27; A$4:A$27)
=PRONOSTICO.ETS(A28; B$4:B$27; A$4:A$27; 12)
=PRONOSTICO.ETS(A28; B$4:B$27; A$4:A$27)
=PRONOSTICO.ETS.ESTACIONALIDAD(B$4:B$27; A$4:A$27)
Each formula forecasts the date in A28 using only the data in rows 4 to 27 (the 24 training months), so the method does not "see" the future.
The results
The mean absolute percentage error (MAPE) of each method over the 12 test months:
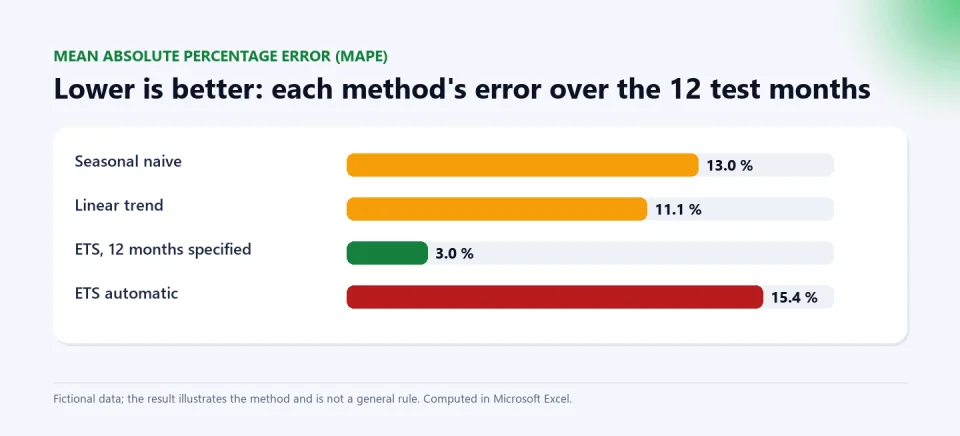
| Method | MAPE | What happened |
|---|---|---|
| ETS with 12 months specified | 3.0% | Captured the January-February and July peaks |
| Linear trend | 11.1% | An almost flat line: ignored seasonality entirely |
| Seasonal naive | 13.0% | Got the shape right but not the growth: underestimated the whole year |
| Automatic ETS | 15.4% | Excel detected a 6-month seasonality, not 12: overestimated most of the year |
The surprise is the last row. When I asked Excel to detect the seasonality (FORECAST.ETS.SEASONALITY), it returned 6, because the data have two peaks per year. The resulting forecast ended up worse than a plain straight line. When you know the cycle is annual, specify it: in this example it cut the error from 15.4% to 3.0%. And that does not mean automatic always fails; it means you have to check.
The seven most common mistakes
- Extrapolating a straight line over seasonal data. The linear trend gives a "reasonable" number that ignores the peaks.
- Trusting automatic seasonality without checking it. Compare what it detects with what you know about the business.
- Not running a backtest. If you do not forecast a period you already know, you do not know whether the method works.
- Too little history. To estimate seasonality you need at least two full cycles; with 12 months there is no way to tell it from noise.
- Ignoring shocks. A pandemic, a closure or a policy change breaks the pattern; the model cannot foresee them.
- Delivering a single number. A forecast without a confidence interval hides uncertainty. In the workbook, the January 2025 forecast with all 36 months is about 199 units, with a 95% interval of roughly 189 to 208 (
FORECAST.ETS.CONFINT). - Irregular or missing dates. ETS functions need a timeline with constant steps (for example, monthly).
And a warning about charts: a forecast plotted with a truncated axis or two different scales can mislead as much as those in charts that lie.
The exercise workbook
The file includes the 36 months of data, the backtest already built (with the four formulas and the errors by month), five exercises and their solutions. Some exercises: compute each month's seasonal index (in the example, January is about 1.24 and May 0.79 relative to the average); forecast January 2025 with a confidence interval; replace the naive method with "same month last year plus average growth"; and simulate a shock (a 40% drop in April) to see how forecasts degrade. That last practice teaches the most important thing: models learn from the past and do not warn you when the past stops being useful.
You can also use Excel's wizard ("Data", "Forecast Sheet"), which applies ETS and draws the interval; the results depend on what it detects, and it is worth applying the same backtest.
Colombia, Latin America and the world
Forecasting well has huge practical value where there is little slack: a school estimating enrollment to hire teachers, a shop deciding how much inventory to buy before the school season, a small business planning its cash flow. In Colombia, the seasonality of the school calendar (A and B calendars), the June and December bonuses and holidays create very marked patterns that a good forecast must respect; and swings in the dollar or inflation can break the trend. For principals and administrators, the forecast is an aid to decide, not a promise; for math or technology teachers, it is an excellent case for teaching how to evaluate models with real data; for families and the community, understanding that an estimate has a margin of error helps read the figures they are shown.
Tools to work with your data in Excel
If you want to automate tasks with your data or have orderly templates, look at these options. And to review statistics and functions with AI support, there is a free Excel with AI guide.
Keep reading: when Excel stops being the solution, the hidden risk of Excel and how to automate in Excel. For analysis of your own classroom data, see the AI Exam Generator.
Frequently asked questions
What is the difference between FORECAST.LINEAR and FORECAST.ETS?
FORECAST.LINEAR draws a straight line and ignores seasonality; FORECAST.ETS uses triple exponential smoothing and models level, trend and seasonality.
How much data do I need for a seasonal forecast?
At a minimum, two full cycles (for example, 24 months for an annual cycle); ideally, more.
How do I evaluate whether a forecast is good?
With a backtest: train on part of the data, forecast what you already know and compute an error such as MAPE. Always compare with a simple method, such as repeating last year.
Can I trust Excel's automatic seasonality?
Check it. In the example it detected 6 months instead of 12 and the error went up. If you know the cycle, specify it.
Does a forecast predict the future?
No: it projects patterns from the past. If the context changes (a closure, a crisis, a new policy), the forecast loses validity.
Try it with your data. Download the forecasting workbook (in Spanish), solve the exercises and replace the fictional data with your sales, enrollments or consumption; then compare the four methods in the "Pronostico" sheet before believing in a number. It requires Excel 2016 or later (ETS functions).
Food for thought
A well-presented forecast looks like a fact, even if it is an informed bet. Who should answer when an important decision (hiring teachers, buying inventory, closing a branch) is made on a forecast that turned out wrong: whoever built the model, whoever presented it or whoever decided without asking about the margin of error? And if models learn from the past, how do we keep them from locking us into it just when the future needs to be different?
Was this article helpful?
React and share it with someone who might find it useful.
- Like 0
- Insightful 0
- Celebrate 0
- Love 0
- Thought-provoking 0
Prefer to have it ready?
More guides in Excel automation for office work