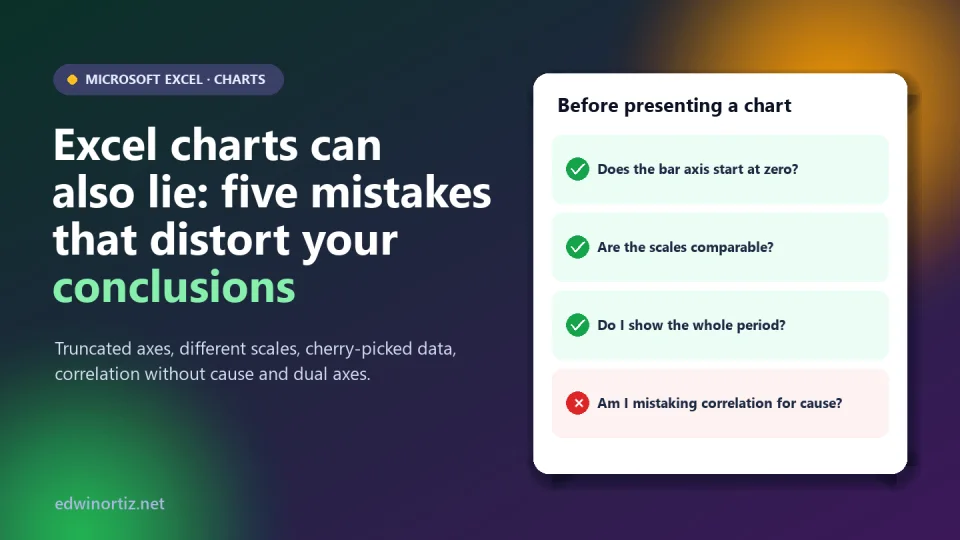
An Excel chart takes three clicks and looks objective: it is "the data", drawn. But a chart is not data: it is a presentation decision, and that decision can inflate a difference, hide a drop or invent a relationship that does not exist. Sometimes it is deliberate; almost always it is carelessness, because Excel picks the axis, the scale and the style for you.
In this article I show you five mistakes with their misleading and corrected versions (all made in Excel with hypothetical data), a VBA macro that detects one of them in your workbooks and a checklist to review a chart before presenting it. Tested in Microsoft Excel on October 9, 2026.
Summary. The five mistakes: a truncated axis on bars, different scales across comparable charts, a period or data chosen for convenience, correlation presented as cause and dual axes tuned to force a relationship. The common rule: the chart must show what the data say, not what you would like them to say.
Mistake 1: the truncated axis
In a bar or column chart, the length of the bar represents the value. If the axis does not start at zero, length stops being proportional and a small difference looks huge. Here, the pass rates of three schools (92%, 94% and 93%) with the axis cut at 91 make B look like triple A:
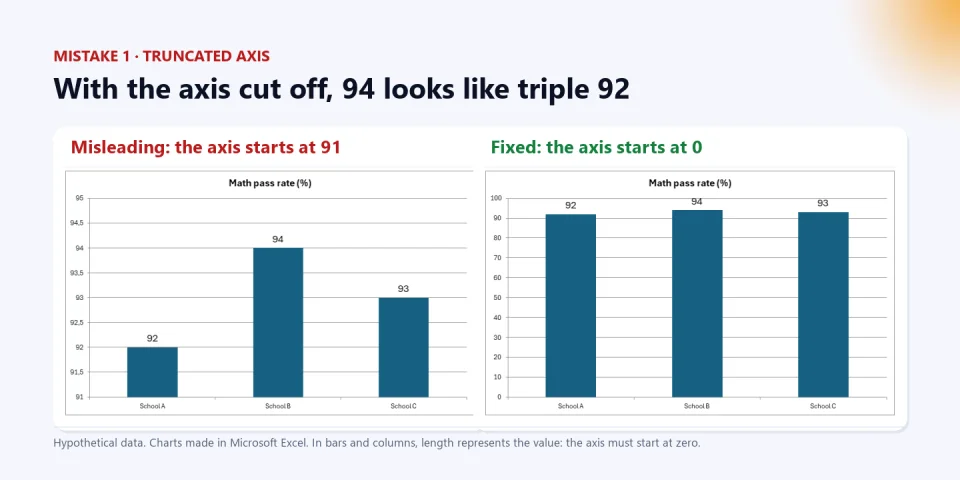
How to fix it in Excel: right-click the vertical axis > Format Axis > Bounds > Minimum = 0. In line charts, an axis that does not start at zero is acceptable if the goal is to show variation, but say so and do not exaggerate it.
Mistake 2: inconsistent scales across comparable charts
Excel adjusts each chart's scale to its own data. If you put two charts side by side, each with its own scale, two very different series look alike. In the example, the South branch sells ten times more than the North branch, but looking at the two charts together with automatic scales they seem identical:
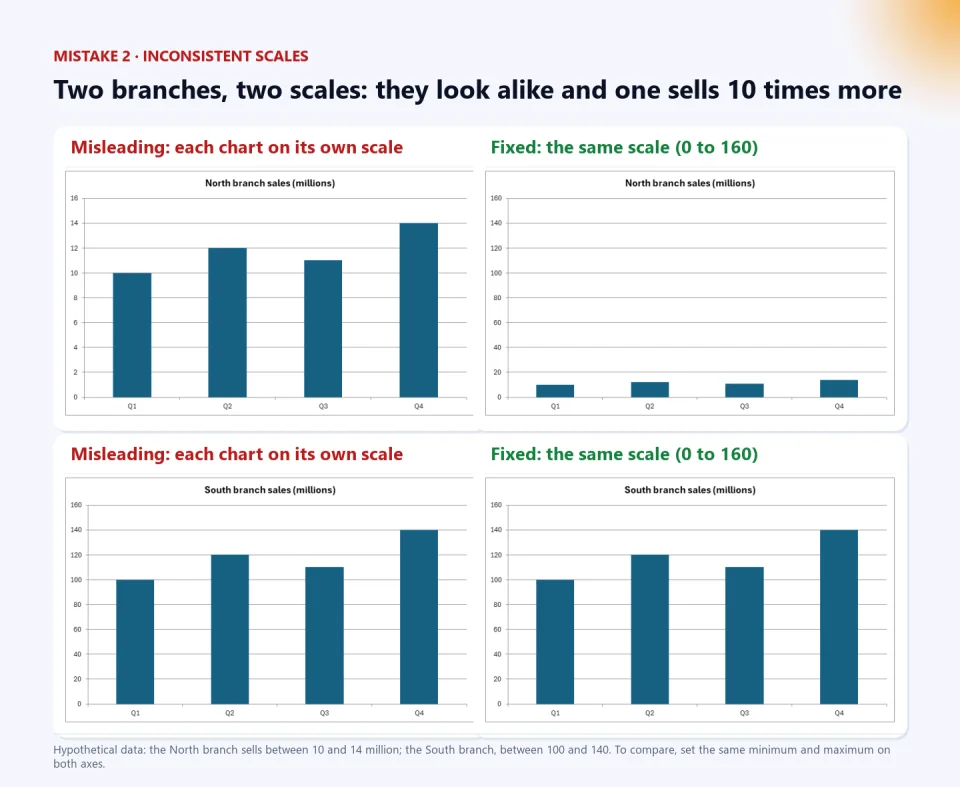
How to fix it: set the same minimum and maximum on the axes of all charts to be compared (here, 0 to 160), or put both series in one chart.
Mistake 3: biased selection of the period or the data
With the same data you can tell opposite stories depending on the window you choose. Showing only January to July says "growth!"; the full year reveals that sales fall from August on:
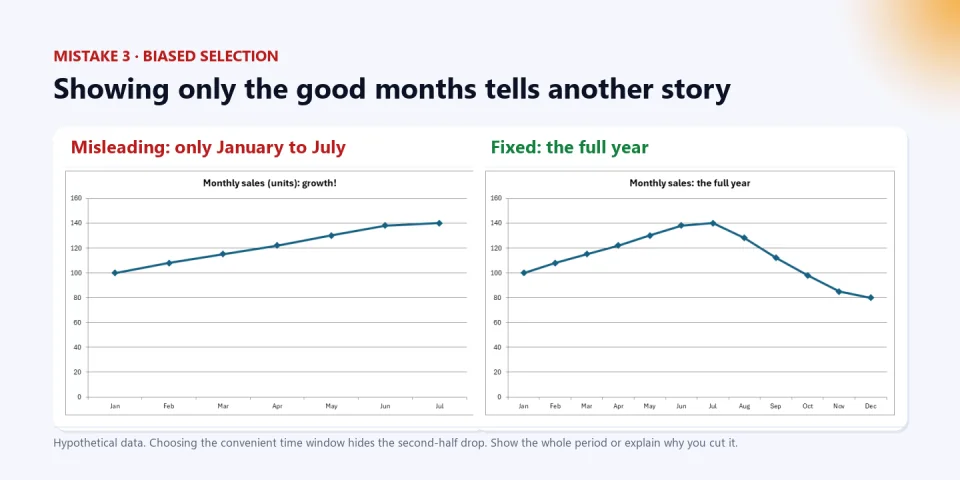
How to fix it: show the full period, or justify the cut (for example, "since the price changed"). If you compare with a previous year, compare the same months. And ask yourself what data were left out: schools that did not respond, lost customers, months with no records.
Mistake 4: confusing correlation with causation
Two series can move together without one causing the other. In the example (invented data), ice cream sold and sunburns have a very high correlation, and Excel confirms it:
=CORREL(A2:A13,B2:B13)     → 0.998
=RSQ(B2:B13,A2:A13)        → 0.996
But ice cream does not cause sunburns: both depend on heat and season. That hidden third variable is called a confounder.
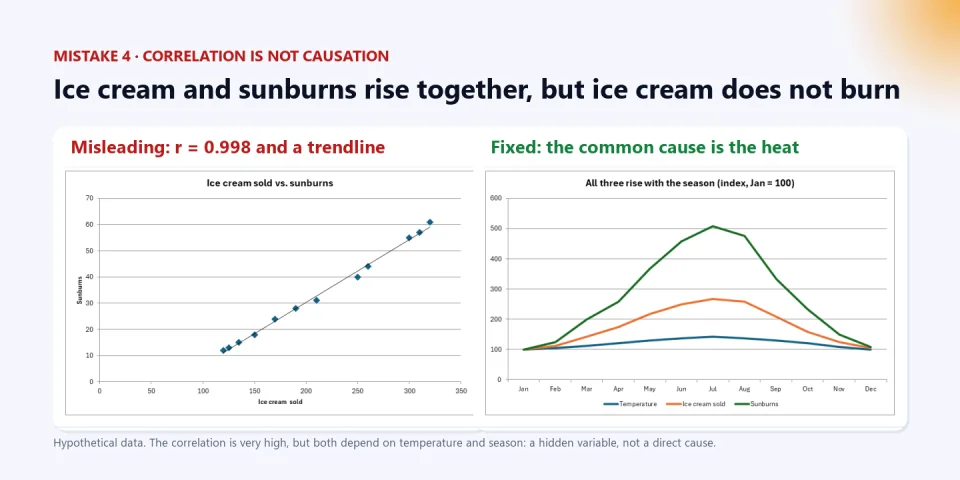
How to avoid it: before writing "X causes Y", ask whether a third variable affects both, whether the order in time makes sense and whether there is a plausible mechanism. A high correlation is a clue to investigate, not proof. Spurious correlations (such as those collected by Tyler Vigen) show that with enough series, some always "match".
Mistake 5: dual axes that force a relationship
Excel's secondary axis lets you chart two different quantities, but it also lets you tune the two axes until the lines coincide. In the example, advertising spend varies by less than 5% and visits by less than 7%: there is hardly any movement. With two cropped axes, both lines seem to dance together:
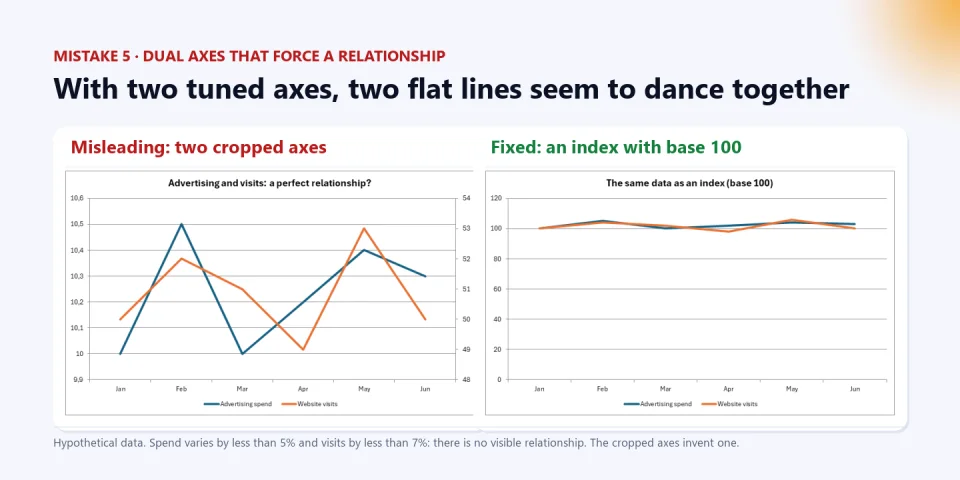
How to fix it: avoid dual axes unless essential; better use an index (each series divided by its starting value, times 100), which puts both on the same scale, or two separate charts with axes that start at zero.
A macro to detect truncated axes
If you receive workbooks with many charts, this VBA function goes through all the sheets and lists the column or bar charts whose value axis does not start at zero. I tested it with three column charts (one with the axis at 90, one at 0 and one automatic) and it flagged only the first:
Public Function RevisarEjes(Optional libro As Workbook) As String
    Dim ws As Worksheet, co As ChartObject, ax As Axis, msg As String, tipo As Long
    If libro Is Nothing Then Set libro = ActiveWorkbook
    For Each ws In libro.Worksheets
        For Each co In ws.ChartObjects
            tipo = co.Chart.ChartType
            If tipo = xlColumnClustered Or tipo = xlColumnStacked Or tipo = xlBarClustered Or tipo = xlBarStacked Then
                Set ax = co.Chart.Axes(xlValue)
                If Not ax.MinimumScaleIsAuto Then
                    If ax.MinimumScale <> 0 Then msg = msg & ws.Name & " / " & co.Name & ": the axis starts at " & ax.MinimumScale & vbLf
                End If
            End If
        Next co
    Next ws
    If msg = "" Then msg = "No bar or column chart has a truncated axis."
    RevisarEjes = msg
End Function

Sub MostrarRevision()
    MsgBox RevisarEjes(ActiveWorkbook)
End Sub
Use it as a control on the "Control" sheet of your reports (like the one I propose in the article on the hidden risk of Excel). To save macros, the workbook must be .xlsm, and remember that Microsoft blocks macros in files downloaded from the internet by default.
Colombia, Latin America and the world: where these distortions matter
Misleading charts are not just a problem for the press or politics. They slip into the results report a school presents to families, into the sales comparison that reaches the manager, into a bid presentation or a thesis. Worldwide, visualization specialists have warned for decades about the "lie factor" of charts; in Colombia and Latin America, where many decisions in small businesses, schools and offices rest on charts made in Excel by one person, the risk is higher because they are rarely reviewed. For a teacher or school leader, the lesson is twofold: build honest charts and teach students to read other people's (a key data-literacy skill). For a manager, always ask for the axis, the period and the source. For families, look at where the axis starts before believing a chart.
Checklist: review a chart before presenting it
This is the practical resource. Use it with one of your own reports:
| Question | If the answer is "no"… |
|---|---|
| In bars and columns, does the value axis start at zero? | Fix the minimum bound or switch to a line chart and flag the cut. |
| Do the charts being compared share the same scale? | Set equal minimum and maximum, or put them in one chart. |
| Do I show the whole relevant period, or did I justify the cut? | Widen the window or explain the criterion. |
| Did I include all the data that belong (without leaving out uncomfortable cases)? | Check what was left out and why. |
| Am I claiming a cause from a correlation alone? | Change the wording ("is associated with") or find more evidence. |
| Am I using dual axes? | Prefer an index or two separate charts. |
| Does the title say what the chart shows (not an exaggerated conclusion)? | Describe the data; leave interpretation to the text. |
| Are units, source and period clear? | Add a footnote with source and date. |
| Did someone else review it with fresh eyes? | Ask for a second read before sending it. |
Tools to work with your data with judgment
A good chart starts with clean data. The free Excel con IA download includes the PerfilarDatos macro, which checks the types, blanks and odd values of your table before charting, and in the article how to import a CSV correctly you will see how to keep Excel from damaging your data at the source. If you want someone to review a report with charts or help you build templates with controls, the PLUS advisory accompanies you; and to present results without repeating work, Mail merge and individual PDF generation builds per-person documents from your Excel sheet. Learn more on my Excel playlist on YouTube (in Spanish).
Keep reading: the hidden risk of Excel, how to automate Excel and Is Excel dead in the age of AI?.
Frequently asked questions
Must a bar chart always start at zero?
Yes, because the bar's length represents the value. In a line chart you can crop the axis to show variation, but it is wise to flag it and not exaggerate.
How do I change the axis minimum in Excel?
Right-click the axis > Format Axis > Bounds > Minimum. Set 0 (or the value you decide) and check that the maximum is reasonable.
Does a high correlation prove a cause?
No. It can be due to a third variable, chance or coincidence in time. Use it as a clue to investigate, not as a conclusion.
What is better than a dual axis?
An index (each series divided by its starting value) on a single axis, or two separate charts with axes that start at zero.
How do I detect truncated charts in a workbook with many charts?
With this article's RevisarEjes macro, which lists the bar or column charts whose axis minimum is not zero.
Review one of your reports this week. Pick a report with charts, apply the checklist and fix at least one. If you want an expert second look at your reports and templates, write to the PLUS advisory.
Food for thought
An honest chart is almost always less spectacular than one that exaggerates, and in a meeting the spectacular one wins. If we all know that a cropped axis misleads, why do we keep rewarding charts that impress over charts that inform, and whose responsibility is it: whoever draws it, whoever presents it or whoever does not dare ask where the axis starts? And should we teach reading a chart at school with the same seriousness with which we teach reading a text?
Was this article helpful?
React and share it with someone who might find it useful.
- Like 0
- Insightful 0
- Celebrate 0
- Love 0
- Thought-provoking 0
Prefer to have it ready?
More guides in Excel automation for office work