Every time PISA results come out, the same scene plays out: headlines about Singapore and China at the top, a paragraph about Finland, a sad line about Colombia and, a week later, the topic disappears. I have been teaching mathematics and technology in Colombian schools for more than twenty years, and the headline is no longer enough for me. I want to understand what the world’s best education systems did, how much of it depends on money, how much on culture and how much on decisions Colombia could also make.
On September 8, 2026, the OECD published the PISA 2025 results: 91 countries and economies, more than 760,000 fifteen-year-olds and the lowest OECD average in the history of the test in all three subjects. With that data, Education at a Glance 2026 and the TALIS 2024 teacher survey, I built this comparison, which ends with a checklist for Colombia.
PISA 2025: who is on top and where Colombia stands
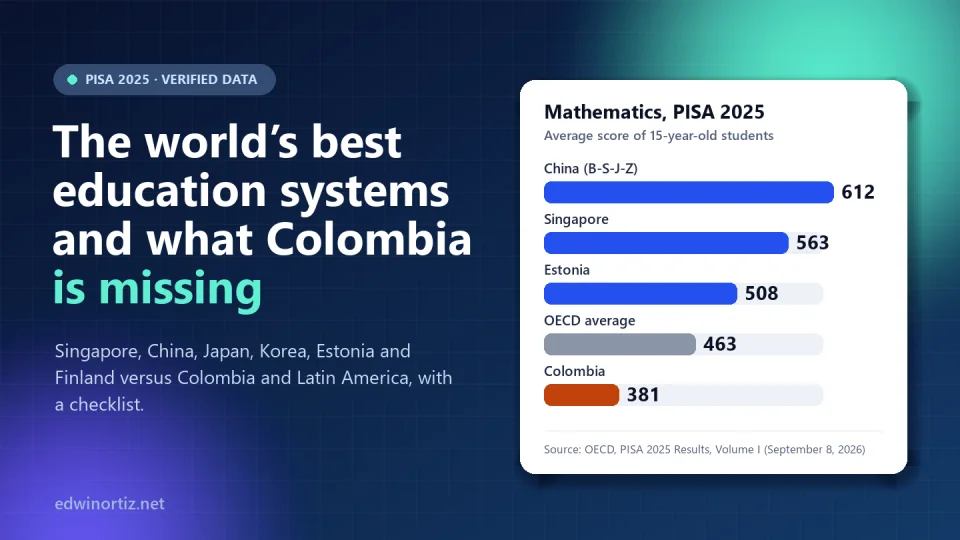
Asian systems dominate again. In mathematics, the Chinese sample of Beijing, Shanghai, Jiangsu and Zhejiang (B-S-J-Z) scored 612, Singapore 563, Macao 549, Chinese Taipei 546, Japan 525, and South Korea and Hong Kong 522. Estonia, Europe’s best, scored 508. Finland, the model for years, fell to 469, just six points above the OECD average (463).
Colombia scored 381 in mathematics, 399 in reading and 414 in science, according to the OECD country note. The changes since 2022 are not statistically significant (−2, −9 and +3), but the decline in mathematics and reading since 2018 is. In the region, Uruguay, Chile, Mexico, Costa Rica and Peru are ahead of us.
| System | Mathematics | Reading | Science |
|---|---|---|---|
| China (B-S-J-Z) | 612 | 527 | 597 |
| Singapore | 563 | 535 | 560 |
| Japan | 525 | 503 | 538 |
| South Korea | 522 | 501 | 526 |
| Estonia | 508 | 499 | 527 |
| Finland | 469 | 474 | 504 |
| OECD average | 463 | 461 | 482 |
| Chile | 403 | 436 | 442 |
| Mexico | 388 | 408 | 414 |
| Colombia | 381 | 399 | 414 |
| Brazil | 377 | 408 | 409 |
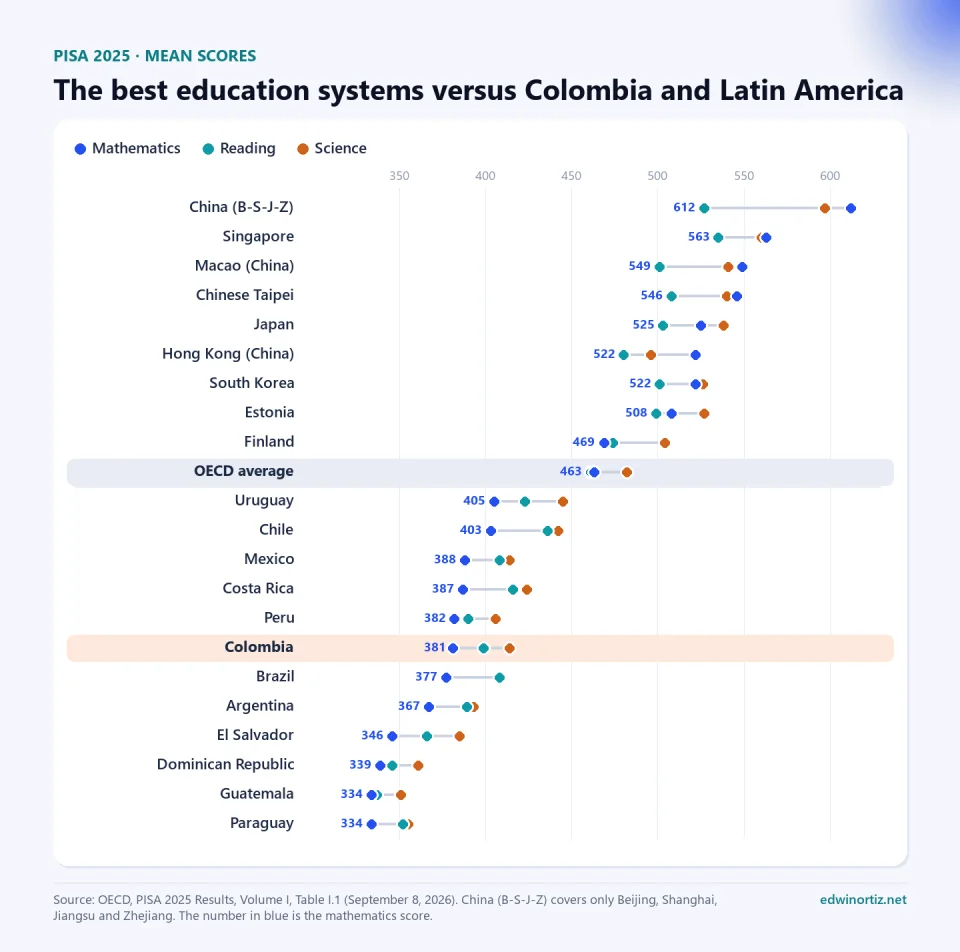
PISA 2022 showed the same order: Singapore 575, Japan 536, Korea 527, Estonia 510, Finland 484 and Colombia 383, according to PISA 2022 Volume I; in 2018 the Chinese sample had scored 591. This is a trend, not a stroke of luck.
Beyond the average: how many fall behind and how many excel
The average hides what matters most. PISA defines Level 2 as the baseline for using mathematics in simple everyday situations. In Colombia, 71% of fifteen-year-olds do not reach it. In Singapore it is 11.2%; in Japan, 16.1%; across the OECD, 34.9%. At the other end, only 0.2% of Colombian students reach Levels 5 and 6, versus 37.4% in Singapore and 54.2% in the Chinese sample.
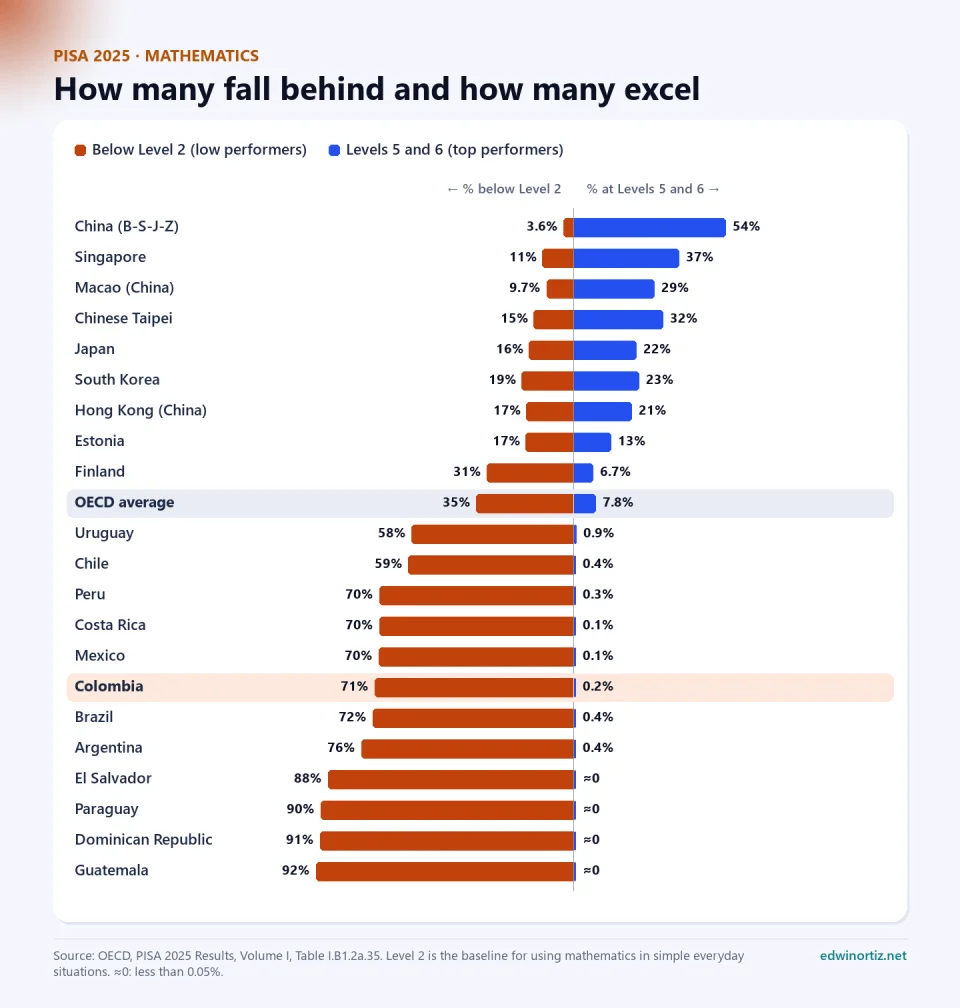
Worse still: 43.9% of Colombian students are below Level 2 in all three subjects at once (OECD: 19.7%). This is not a mathematics problem; it is a foundations problem.
The trend: who improves, who stalls and who falls
| Mathematics | 2012 | 2018 | 2022 | 2025 |
|---|---|---|---|---|
| Singapore | 574 | 569 | 575 | 563 |
| Japan | 536 | 527 | 536 | 525 |
| South Korea | 554 | 526 | 527 | 522 |
| Estonia | 521 | 523 | 510 | 508 |
| Finland | 519 | 507 | 484 | 469 |
| OECD average (35 countries) | 491 | 490 | 475 | 466 |
| Chile | 423 | 417 | 412 | 403 |
| Colombia | 377 | 391 | 383 | 381 |
Three takeaways. First: almost everyone is declining, including the best; the pandemic and changes in reading habits and screen use weigh everywhere, as I discussed when analyzing PISA in Latin America. Second: Colombia remains just four points above its 2012 score and lost what it had gained up to 2018. Third: Finland lost 50 points in thirteen years, roughly two and a half years of schooling. No system is safe.
How the world’s best education systems reached the top
Singapore: a state plan and a teacher pipeline
Singapore became independent in 1965 with no natural resources and decided its resource would be its people. What stands out is the consistency: in 1997 Prime Minister Goh Chok Tong launched “Thinking Schools, Learning Nation”; in 2004 Lee Hsien Loong announced “Teach Less, Learn More,” which cut content to go deeper; in 2023 it removed mid-year examinations, and in 2024 it ended the “Express” and “Normal” streams in secondary school. Each reform corrects the previous one, but the direction does not change.
Teachers are the heart of the system. There is a single teacher-education institution, the National Institute of Education (NIE), and the Ministry recruits roughly from the top third of each cohort. Training is fully funded by the Ministry, and future teachers commit to teach for at least three years. In 2026 it announced raises of 2% to 9% to stay competitive with the market. In TALIS 2024, 71% of Singapore’s teachers felt their profession is valued by society.
Two caveats: Singapore spends only 2.19% of its GDP on education (2024), because its GDP per capita is very high: cumulative spending per student exceeds USD 166,000. And it is one of the systems where social background weighs most: 103 points separate the richest and poorest quarters in mathematics, more than the OECD average (83). The Ministry of Education itself acknowledges that the gap between its top and low performers widened.
China, Hong Kong, Macao and Taipei: excellence with an asterisk
China’s 612 points must be read carefully. The B-S-J-Z sample covers only four of the country’s richest regions; the OECD itself warned in 2018 that they are “far from representing China as a whole,” and they account for about 13% of its population. It is as if Colombia took part with only Bogotá, Medellín, Bucaramanga and Tunja.
China also shows the costs of the model. In 2021 it launched the “double reduction” policy, which banned for-profit tutoring in school subjects during compulsory education, to ease the pressure on families. Taipei held steady (547 in 2022 and 546 in 2025), while Hong Kong fell 18 points in mathematics and 20 in reading. Macao, by contrast, is the most equitable case in the group: socio-economic status explains just 4.2% of the variation in mathematics there, versus 12% in the OECD and 17% in Colombia.
Japan and South Korea: rigor, prestige and the price of pressure
Japan and Korea share a culture that treats study as a family duty. In Korea, primary teacher training takes students from among the best on the national entrance exam, according to the 2007 McKinsey report. Japan is famous for “lesson study” (jugyō kenkyū), in which teachers plan, observe and refine the same lesson together.
But there is a dark side. In 2025 Korean families spent 27.5 trillion won on private education (hagwon cram schools), with a 75.7% participation rate and a record 604,000 won a month per enrolled student; in 2024 the total had been 29.2 trillion. A study presented in September 2026 at a Bank of Korea conference estimates that, without that competition, fertility would be 28% higher, according to The Korea Times, in a country that had 0.72 children per woman in 2023. And according to official statistics reported by the Korean press in May 2026, suicide was the leading cause of death among people aged 9 to 24 in 2024, for the fourteenth year in a row.
In Japan, spending on juku (cram schools) averages about 230,000 yen a year per public junior-high student, according to the Ministry of Education survey. Its teachers work 53 hours a week, one of the highest figures in TALIS 2024, and only 49.3% would choose the profession again. Part of that success is paid for outside school, with families’ money and with mental health.
Estonia: equity as a strategy
Estonia proves you don’t need to be Asian or very rich to be at the top. It has a common nine-year basic school, with no tracking before age 16; it has bet on digital since 1996 with “Tiger Leap”, and it gives schools a lot of autonomy. According to the Estonian Ministry of Education, 82.8% of its students reach at least Level 2 in mathematics, the highest share in Europe.
Its warning signs are also instructive: reading has fallen 24 points since 2018 and the teaching workforce is aging. Education at a Glance 2026 reports that 40% of secondary teachers are 55 or older, and only 20.3% of Estonian teachers feel society values their work.
Finland: trust, equity and a decline that forces a rethink of the myth
Finland built its reputation on teachers with master’s degrees, broad autonomy, little standardized testing and strong equity. Selection is still demanding: in 2025 the University of Helsinki admitted only 8.2% of applicants to its primary-teacher program. But its reading score went from 546 in 2000 to 474 in 2025, and only 41% of its students say they try harder when a task gets difficult. I look at it in depth in Finland’s education system: myth or reality?
Is it about money? Spending per student and results
Yes and no. In PISA 2022 the OECD found that, up to about USD 75,000 in cumulative spending per student between ages 6 and 15, more spending is linked to better results; above that threshold, much less so. Colombia spent USD 37,315, half the threshold and just over a third of the OECD average (102,612). Within the OECD, only Chile, Colombia, Greece, Latvia, Lithuania, Mexico and Türkiye were below it.
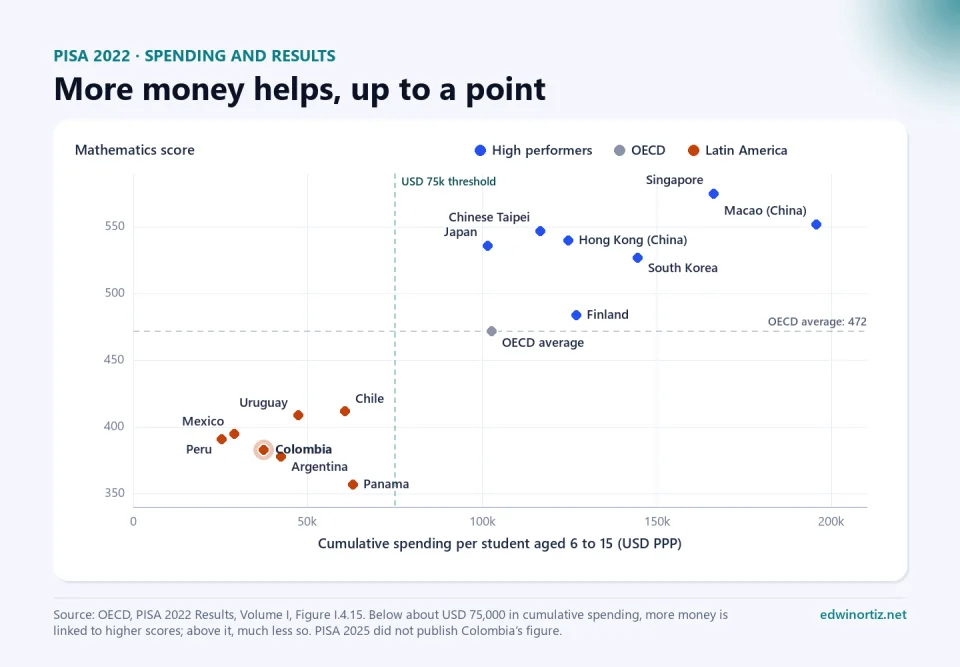
But money doesn’t explain everything: above the threshold, Japan achieves far more than the OECD average with similar spending, and Finland spends more than Japan with weaker results.
Education at a Glance 2026 records spending of USD 3,405 per student from primary to tertiary in Colombia (a partial, public-only figure), versus 15,897 in the OECD. The official Ministry of Education series puts public spending on education at 4.1% of GDP in 2024. And Legislative Act 03 of 2024 raises the General Participation System (SGP), the transfers to regions, to 39.5% of the nation’s current revenues over twelve years, but that clock starts only when Congress passes the so-called competencies law, which as of October 2026 is still pending, according to La República. More money without clear rules can end up in payroll and bureaucracy, not learning.
Teachers: selection, pay and prestige
Every high-performing system takes care of its teachers. But there is a myth to debunk: Andreas Schleicher, the OECD’s Director for Education, showed in 2025 that in no country are teachers in the top third of tertiary-educated adults on skills tests. What these systems do well is train, support and retain those who join.
Colombia’s data are surprising. In TALIS 2024, 54% of our lower-secondary teachers felt society values their profession, versus 21.7% in the OECD; we rank 12th out of 56 systems. 97% are satisfied with their job and 91.2% would become teachers again. 18.2% have an assigned mentor, twice the OECD average. But 24% say cost keeps them from professional development, versus 11% in the OECD, according to report 132 by Javeriana University’s LEE.
| Teacher indicator | Colombia | OECD | High benchmark |
|---|---|---|---|
| Feel their profession is valued by society (TALIS 2024) | 54% | 21.7% | Singapore 71% |
| Starting salary, lower secondary (USD PPP, 2025) | 36,196 | 49,514 | Finland 50,227 |
| Typical top salary (USD PPP, 2025) | 66,011 | 77,862 | Korea 116,446 |
| Used artificial intelligence in the past year | 52.8% | 36.3% | Singapore 74.9% |
| Weekly working hours / teaching hours | 38.7 / 26.0 | 38.5 / 21.2 | Singapore 46.8 / 17.6 |
That last row says a lot: Singapore’s teachers work more hours than Colombia’s but teach far fewer classes. The rest of the time they plan, mark, observe colleagues and learn. In Colombia we teach 26 hours a week and many of us plan at night. On selection, the 2022 teacher hiring competition had 378,212 candidates sitting the tests for 37,480 posts, about ten per post, according to the Ministry of Education; the next competition will offer more than 26,300 posts. Merit exists; what is missing is initial training and support that match the filter.
If you are preparing, the free practice test for Colombia’s teacher competition (in Spanish) lets you measure yourself with exam-style questions at your own pace, and here is the updated schedule with registration in 2027 (in Spanish).
Latin America: the problem starts long before age 15
PISA measures at 15, but the gap forms earlier. In UNESCO’s ERCE 2019 assessment, 49.2% of sixth graders in the region were at the lowest level in mathematics, and the World Bank estimates that 83% did not reach minimum proficiency. Before the pandemic, according to the World Bank indicator, 51.4% of Colombian ten-year-olds could not read and understand a simple text (“learning poverty”); for the region, the World Bank estimates that figure may have reached 79% after school closures. The IDB and the World Bank summed it up in 2024: three in four fifteen-year-olds in the region lack basic mathematics skills.
In Colombia, LEE report 140 shows that the average Saber 11 score (the national exit exam) rose to 255.8 in 2025, the second highest since 2014, but the gap between urban and rural schools reached 26.7 points, the largest on record, and the gap between private and public schools was 27.5. According to DANE, 67.4% of school sites are rural, but only 57.2% of them have internet, versus 95% of urban sites. And of every 100 children who started first grade in 2013, only 44 reached grade 11 on time, according to LEE data reported by El Tiempo.
What cannot (and should not) be copied
- PISA doesn’t measure everything: not art, citizenship, coexistence or happiness.
- Samples matter. Colombia’s covers 75% of fifteen-year-olds; the rest are out of school or held back, and would probably score lower. Expanding coverage may lower the average for a while without that being a failure.
- Culture can’t be imported by decree. Korean family pressure produces results, but also anxiety, private spending and inequality.
- Contexts differ. Singapore is a city-state of six million people with no scattered rural population or armed conflict; Colombia has more than nine million students, many in villages without internet.
- Autonomy works with capacity. Without well-trained teachers and social trust, autonomy turns into abandonment.
What is transferable are the deep decisions: early childhood, time for teachers to prepare and learn, policies sustained for decades and assessment to correct, not to punish.
Colombia’s gaps in a single image
I compared Colombia with the average of high-performing systems across seven dimensions. Each bar is Colombia’s figure as a percentage of the benchmark: 100 means the same level.
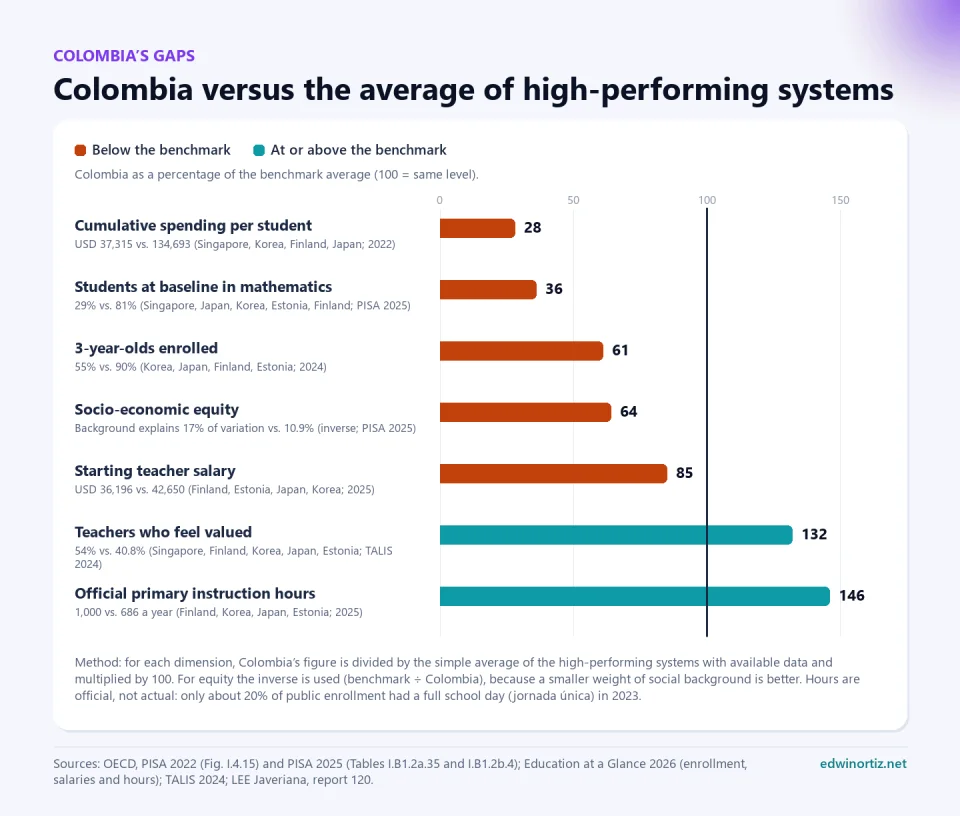
The image debunks two beliefs. Colombia does not have fewer official class hours than the best: it has many more, although in practice the full school day (jornada única) covered only 19.9% of public enrollment in 2023, according to LEE report 120. And our teachers feel more valued than those in Japan or Estonia. The big gaps are in money per student, early childhood, equity and basic learning.
Checklist: how Colombia could get closer to the best
Key: ✅ progressing, ⚠️ partial, ❌ pending. Time frames: short (1 to 2 years), medium (3 to 6) and long (more than 6).
| Dimension | Status | Main responsibility | Time frame |
|---|---|---|---|
| 1. Long-term state vision | ❌ Pending | State, Congress, Ministry of Education | Short to agree on it, long to sustain it |
| 2. Early childhood | ❌ Pending | Ministry, ICBF (family welfare agency), local education offices | Medium |
| 3. Teacher training and selection | ⚠️ Partial | Ministry, universities, CNSC (civil service commission) | Medium |
| 4. Teacher time to plan and learn | ⚠️ Partial | Ministry, local education offices, principals | Medium |
| 5. Teacher pay and career | ⚠️ Partial | State, Ministry, Fecode (teachers’ union) | Long |
| 6. Social prestige of teaching | ✅ Progressing | Teachers, media, families | Ongoing |
| 7. Rural equity and connectivity | ❌ Pending | State, ICT Ministry, local education offices | Medium |
| 8. A quality full school day | ⚠️ Partial | Ministry, local education offices | Medium |
| 9. Focused curriculum and formative assessment | ⚠️ Partial | Ministry, ICFES, schools, teachers | Short |
| 10. Inclusion with real adjustments | ⚠️ Partial | Schools, teachers, families | Short |
| 11. Data for early warnings | ⚠️ Partial | Local education offices, schools | Short |
| 12. Stable, well-used funding | ⚠️ Partial | Congress, Finance Ministry, Ministry of Education | Long |
| 13. A culture of effort and partnership with families | ⚠️ Partial | Families, schools, teachers | Ongoing |
1. Long-term state vision ❌
- Evidence: Singapore has kept the same direction since 1997; in Colombia, the 2016–2026 Ten-Year National Education Plan ends this year without ever having been at the center of the debate.
- What is missing and how: a new plan with a few measurable goals (reading in third grade, mathematics in ninth grade, enrollment at age 3), a budget tied to them and an annual public report, built to survive changes of minister.
2. Early childhood ❌
- Evidence: only 55% of 3-year-olds are enrolled (OECD: 75%; Korea: 96%). Net enrollment in transition (the year before first grade) was 61.2% in 2024 and, according to LEE report 139, fewer than four in ten children attend pre-kindergarten or kindergarten.
- What is missing and how: public pre-K and kindergarten in small towns and rural areas, with targets per municipality and specialized preschool teachers.
3. Teacher training and selection ⚠️
- Evidence: the hiring competition is demanding (about ten candidates per post in 2022), but initial training is uneven and 24% of teachers skip professional development because of cost.
- What is missing and how: long, supervised practicums, as in Finland and Singapore; scholarships for strong graduates who choose teaching; induction with a mentor for every new teacher and free continuing education.
4. Teacher time to plan and learn ⚠️
- Evidence: 26 weekly teaching hours in Colombia, 21.2 in the OECD and 17.6 in Singapore.
- What is missing and how: one protected hour a week to work with colleagues, in the style of Japanese lesson study. Meanwhile, tools that free up time: the AI Kit for Teachers includes subject-specific recipes aligned with Colombian standards to plan worksheets and activities in minutes.
5. Teacher pay and career ⚠️
- Evidence: starting salary of USD 36,196 PPP (OECD: 49,514); the typical top of the scale is reached after ten years. Two teacher statutes coexist, Decree 2277 of 1979 and Decree-Law 1278 of 2002.
- What is missing and how: a career that rewards good teaching and instructional leadership, agreed on for the long term between the government and Fecode.
6. Social prestige of teaching ✅
- Evidence: 54% of teachers feel valued (OECD: 21.7%) and 91.2% would choose the profession again.
- What is missing and how: turning that prestige into attracting talented young people to teaching degrees, by showcasing teachers who achieve learning in tough contexts.
7. Rural equity and connectivity ❌
- Evidence: a record 26.7-point urban–rural gap in Saber 11; internet at 57.2% of rural school sites versus 95% of urban ones.
- What is missing and how: resources allocated by need, real incentives for teachers to stay in rural areas and connectivity as a basic school service.
8. A quality full school day ⚠️
- Evidence: 19.9% of public enrollment in 2023, against a 30% target for 2026.
- What is missing and how: infrastructure, school meals and a pedagogical use of the extra hours, evaluating their effect on learning. More hours of the same won’t help.
9. Focused curriculum and formative assessment ⚠️
- Evidence: Singapore cut content and removed mid-year exams to gain learning time.
- What is missing and how: prioritizing essential learning and assessing often to give feedback. The AI Exam Generator creates different versions of the same exam with an answer key; try the free demo.
10. Inclusion with real adjustments ⚠️
- Evidence: the legal framework is advanced (Decree 1421 of 2017 and individual reasonable-adjustment plans, known as PIAR), but teachers apply it with little time and little support.
- What is missing and how: enough support teachers and plans that are used in class. PIAR with AI helps build them with reasonable adjustments, and the first one is free. I go deeper in inclusion in the classroom.
11. Data for early warnings ⚠️
- Evidence: only 44 of every 100 children reach grade 11 on time; dropout was 3.2% in 2023, and 12.3% in Vichada.
- What is missing and how: daily attendance records and a monthly review by class. A well-kept attendance list in Excel already works as an early-warning system.
12. Stable, well-used funding ⚠️
- Evidence: cumulative spending per student at half the OECD threshold; the SGP reform is approved but conditional on the competencies law.
- What is missing and how: passing that law and tying the new resources to early childhood, rural areas and teacher training, with transparency by municipality.
13. A culture of effort and partnership with families ⚠️
- Evidence: in Asia, families support study every day; in Finland, the decline coincides with less reading and less perseverance.
- What is missing and how: reading at home, limits on recreational screen use and simple family–school agreements, like the ones I propose in phones at school.
Three perspectives: teachers, school leaders and families
Teachers don’t need to be compared with Finland at every forum; we need time, useful training and manageable groups. “Fewer forms and more time to teach,” many colleagues tell me, and TALIS proves them right.
School leaders live between pressure for results and scarcity. A principal who assigns mentors, protects an hour of collaborative work and uses attendance data to act in time does more for learning than ten memos.
Families want children who learn and are safe. The Asian lesson is not to pay for cram schools, but to be there: read together, ask what they learned today, respect study time.
Compared with Latin America, Colombia is in the middle of the pack, behind Chile and Uruguay. Compared with the world, the distance is enormous. Both things are true, and the second should keep us up at night.
Frequently asked questions
What are the best education systems in the world according to PISA 2025?
In mathematics, the leaders are the Chinese sample of Beijing, Shanghai, Jiangsu and Zhejiang (612), Singapore (563), Macao (549), Chinese Taipei (546), Japan (525), and Hong Kong and South Korea (522). In Europe, the best is Estonia (508). In reading, Singapore comes first.
How did Colombia do in PISA 2025?
It scored 381 in mathematics, 399 in reading and 414 in science, below the OECD (463, 461 and 482). 71% did not reach the baseline in mathematics. The changes since 2022 are not statistically significant.
Why is Singapore so good at education?
Because of state planning sustained since the 1990s, a single teacher-education institution, demanding recruitment with paid training, a focused curriculum and family support. The cost: heavy pressure and a socio-economic gap larger than the OECD average.
Is Finland still an education model?
It remains above the OECD average and keeps good practices in teacher education and equity, but it lost 50 points in mathematics between 2012 and 2025. Today it teaches as much as a warning as a recipe.
What does Colombia need to improve in PISA?
Expand early education, close the rural gap, give teachers time to plan and learn, sustain education policy beyond a single government, fund schools better with clear rules, and strengthen formative assessment and partnership with families.
Tools to make a difference from your classroom. The world’s best education systems protect teachers’ time to plan, assess well and include everyone. The AI Kit for Teachers includes subject-specific recipes aligned with the Colombian curriculum, at 60,000 pesos per subject. The AI Exam Generator creates different versions of the same exam, with plans from 29,900 pesos. PIAR with AI lets you build one PIAR for free and then choose packages of 5, 10 or 20 plans. And if you are taking the teacher competition, the free practice test helps you see where you stand.
Food for thought
South Korea is among the world’s best in PISA and, at the same time, has one of the lowest fertility rates on the planet, record spending on cram schools and suicide as the leading cause of death among its young people. Finland bet on wellbeing and trust, and now watches its results fall cycle after cycle. Colombia has teachers who feel valued and students who, for the most part, do not reach the minimum. If we could choose, which system would we want for our children: one that takes them to the top of PISA at the cost of their childhood, or a kinder one that leaves them without the tools to compete in the world? And why do we keep believing we have to choose between the two?
Was this article helpful?
React and share it with someone who might find it useful.
- Like 0
- Insightful 0
- Celebrate 0
- Love 0
- Thought-provoking 0
Prefer to have it ready?
More guides in AI and technology for teachers