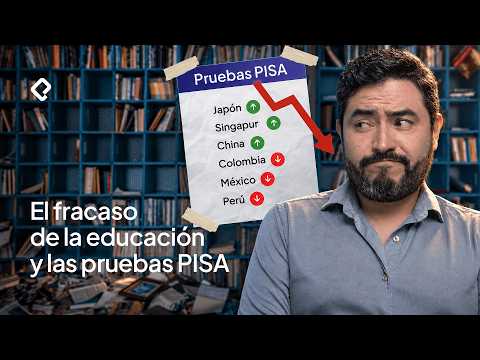
Every time the PISA results are published, Colombia has the same conversation for a week: alarmed headlines, the usual culprits and, soon after, silence. This time, Freddy Vega, cofounder of the online learning platform Platzi, published an analysis more than twenty minutes long (video in Spanish) with an uncomfortable thesis: the region’s educational lag cannot be explained only by poverty, corruption or artificial intelligence.
I watched all of it through the eyes of a math teacher. Here I summarize what it argues, contrast it with what we experience in Colombian classrooms and compare it with what other countries are doing. At the end I leave a question that I believe all of us who work in education should be asking ourselves.
What the video argues
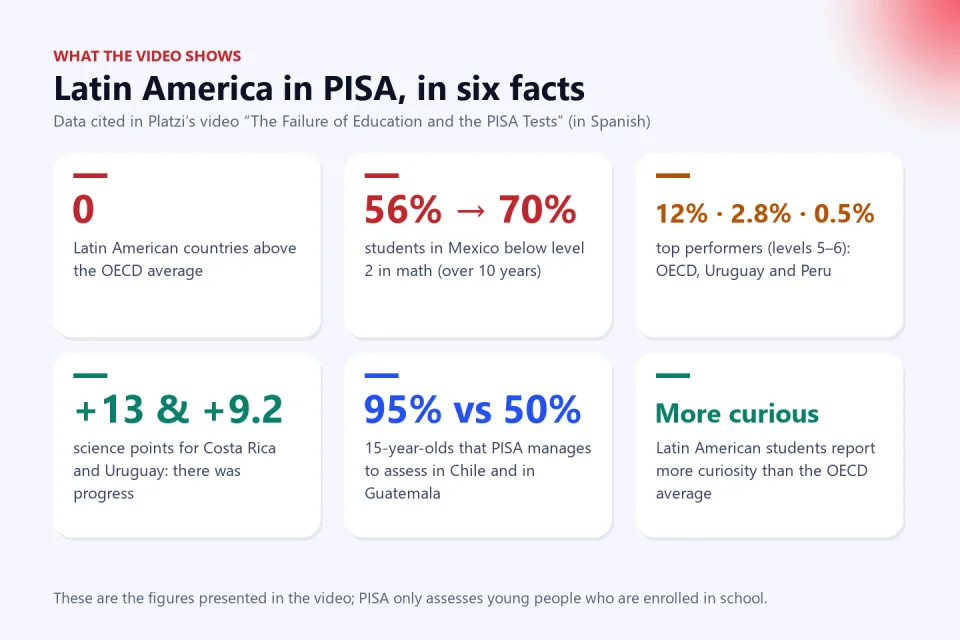
According to the analysis presented in the video, the latest PISA results show a global decline in science, reading and math, and Latin America is among the hardest-hit regions. These are the facts it highlights most:
- No Latin American country is above the OECD average; all of them are below or far below it.
- In Mexico, the percentage of students below level 2 in math, that is, students who cannot solve a basic math problem, went from 56% to 70% in ten years.
- Across the OECD, about 12% of students reach the highest levels (5 and 6); in Uruguay, the region’s best performer, the figure is 2.8%, and in Peru, 0.5%.
- The poorest students in Singapore and Japan score better than the richest students in the region’s best-performing countries.
- There is progress: Costa Rica and Uruguay improved in science, and the region has managed to get more young people into school. Argentina, on the other hand, fell in all three areas.
The video also includes an offer from Platzi: free access to its math fundamentals course for schools that have computers, internet access and the commitment of their administrators. It is worth knowing about, although the analysis does not depend on that offer.
What PISA measures and what it doesn’t
Before drawing conclusions, it helps to understand the test. PISA assesses 15-year-old students in three areas: reading, which in the video’s words measures the patience to understand a complex text; math, which measures the ability to solve a problem step by step; and science, which combines memory with the speed to judge whether something fits with reality.
There is a detail the video itself stresses and that almost never makes the headlines: PISA only assesses those who are in school. According to the data it shows, in Chile the test represents about 95% of 15-year-olds, while in Guatemala it represents barely half. That is why comparing countries without looking at coverage can lead to the wrong conclusions, and why having more young Latin Americans in school is good news even though, in the short term, it pulls the averages down.
The core thesis: it’s not (only) what we usually blame
The most provocative part of the video is its critique of the usual explanations:
- Poverty doesn’t explain everything. According to the analysis, beyond a certain level of spending per student, results stop improving at the same pace. The example it uses is Turkey, which spends about as much per student as Peru and the Latin American average and, even so, managed to improve in science to the point of surpassing the OECD average.
- Nor does inequality, on its own. The video points out that the region’s most advantaged quartile, students from the families with the most resources, got worse, while the most disadvantaged quartile improved slightly. In other words, the problem lies with the system, not just with one group.
- Artificial intelligence plays a role, but it isn’t enough of an explanation. The countries that use it least tend to have better scores, but there are clear exceptions: Singapore uses it a lot and does very well; Vietnam uses it a lot and does not.
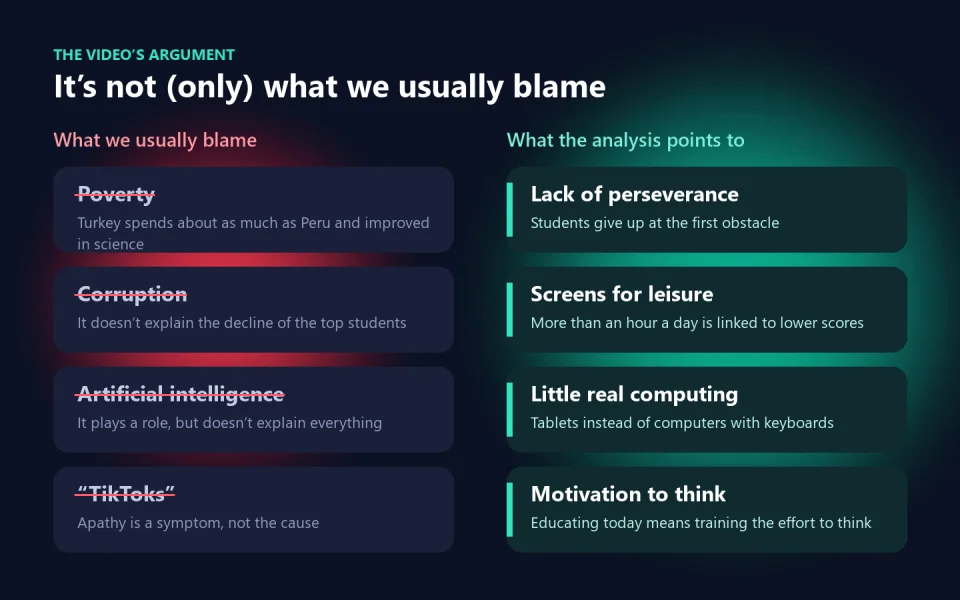
So what does explain the decline? The video points to four factors: a lack of perseverance (students started answering at random in reading and math, the two tests that require you to stay with a problem and think), the use of screens for leisure, the lack of real digital literacy with computers and, above all, a lack of motivation to make the effort to think.
Students: curious, but quick to give up
There is a hopeful finding amid so many poor results: according to the video, Latin American students report more intellectual curiosity than the OECD average. It is not a lack of interest in learning. The problem shows up when learning requires sustained effort: at the first obstacle, more and more young people give up.
That matches what we see in the classroom. A student who has spent years with instant answers one click away, in the search engine, in short videos or in the AI assistant, has a hard time tolerating the discomfort of not knowing. And math is precisely the art of enduring that discomfort long enough to break a problem down into steps.
The video also mentions a global gender gap: more boys among the top math scorers and more girls among the top reading scorers. It is not a question of ability, but of expectations, stereotypes and opportunities that build up from primary school onward, and Colombia is no exception.
Teachers: teaching to think when the answer is a click away
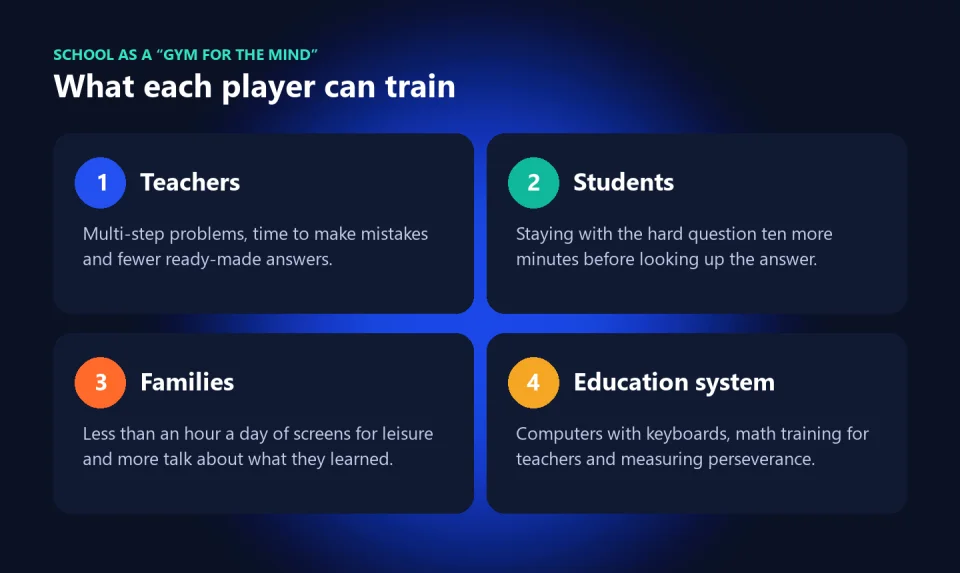
For those of us who teach, the video’s message is demanding but useful. If the central problem is perseverance, a class cannot be limited to explaining and assigning mechanical exercises. Some practices that, in my experience, change the dynamic:
- Multi-step problems with real context, instead of lists of repetitive exercises.
- Explicit time for mistakes: valuing the process and the correction, not just the final answer.
- Think before looking it up: ten minutes of independent work before using the calculator, the search engine or AI.
- Real computing: spreadsheets, folders, files and basic programming on computers with keyboards, not just apps on a tablet.
None of this works if teachers are on their own. Colombia has experience with teacher coaching through programs such as Todos a Aprender (“Everyone Learns”), which focuses on language and math in the early grades; the question is how to bring that kind of support to secondary school, which is where PISA measures results.
Parents: self-control is also learned at home
One of the clearest findings the video cites has to do with screens. When they are used for leisure (social media, short videos, chat), more than one hour a day is associated with lower scores, and each additional hour takes more away. Interestingly, using them for leisure less than one hour a day is associated with better results, which the video interprets as a sign of self-control. Even using devices for learning stops helping once it goes beyond five hours.
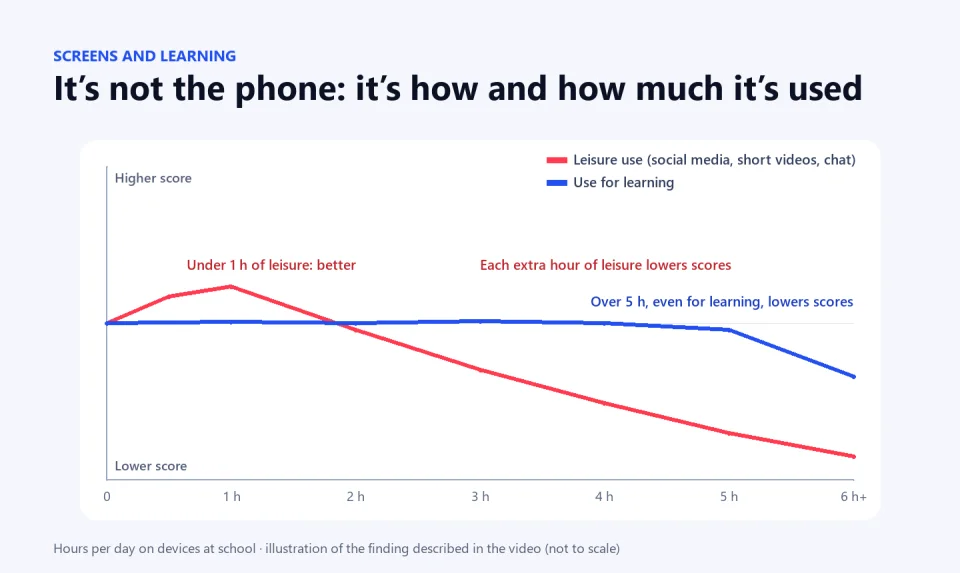
For families, the takeaway is not to ban technology, but to set clear limits and teach how to use it:
- Less than one hour a day of screens for leisure on school days, agreed on with your children rather than imposed by shouting.
- Keep the phone off the study table while homework is being done.
- Ask “How did you solve it?” instead of “Are you done yet?”
- Don’t do their homework for them, and don’t let AI do it either: supporting the effort is more valuable than solving the problem.
- Lead by example: children learn more from how we use our phones than from what we tell them about phones.
Colombia’s education system: extreme results
Colombia has taken part in PISA since 2006 and also has its own assessment system, the Saber tests, national standardized exams administered by ICFES (the Colombian Institute for Educational Evaluation). There is no shortage of data. What the video adds is a troubling observation: Colombia has an average similar to that of several of its neighbors, but a much more extreme distribution. According to the analysis, its best students are better than Mexico’s best, but its worst students are much worse than Mexico’s worst.
That means the same country is home to schools that compete at international standards and schools where most students do not reach the basics. The gaps between urban and rural areas, between public and private schools, and between regions explain much of that chasm.
The point about computing also hits close to home. Programs such as Computadores para Educar (“Computers to Educate”) have brought equipment to thousands of public school campuses, and the video raises a necessary debate: to learn to solve problems, a computer with a keyboard and an internet connection is worth more than a tablet. The question is not just how many devices arrive, but which ones, and how they are used in class.
Colombia compared with Latin America
The video groups the region’s countries into three tiers according to their math results. Uruguay and Chile lead the region, although far below the OECD. Colombia is in the largest group, along with Costa Rica, Peru, Brazil, Argentina, Ecuador and Mexico. And El Salvador, the Dominican Republic, Guatemala and Paraguay lag furthest behind.
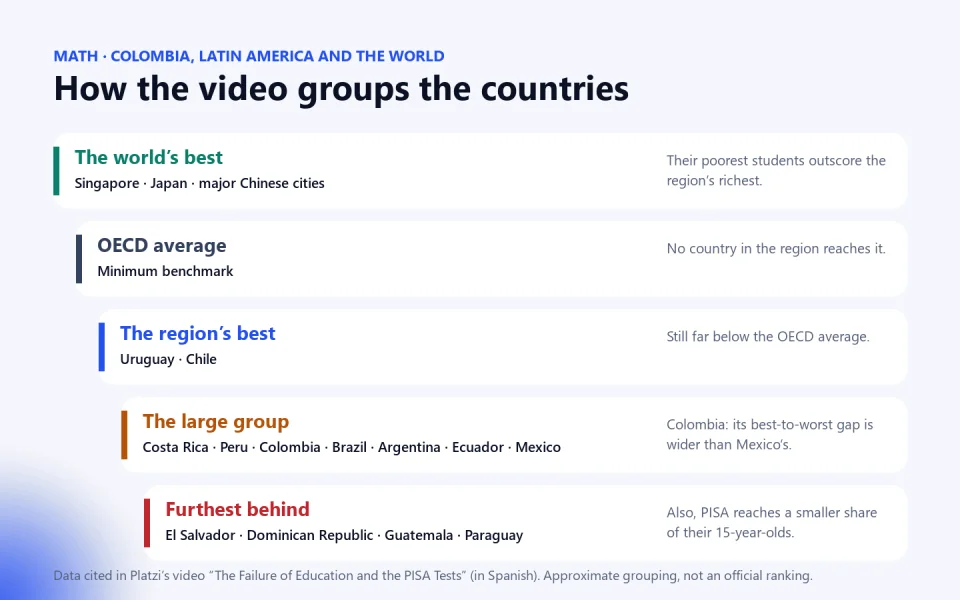
Within that picture there are different stories: Costa Rica is, according to the video, the only country in the region that improved in math and somewhat in reading; Peru, which had been growing remarkably, stalled; Argentina, once a regional benchmark, fell back in all three areas; and Mexico got markedly worse in math. Colombia is not among the cases of collapse, but it is not among the improvers either: it is stuck in the middle.
Colombia compared with the rest of the world
The countries that lead PISA, such as Singapore and Japan, have something in common that the video highlights: very demanding systems, with highly persevering students. According to the analysis, only a few countries, almost all of them Asian, increased their students’ willingness to make an effort when facing a challenge; most declined, and Latin America declined sharply. Japan is also a striking case: it barely uses artificial intelligence in schools and achieves the top scores.
Beyond the video, the international trend points in the same direction. Several European countries have restricted phone use in classrooms, and UNESCO, in its 2023 report on technology in education, recommended using technology in class only when it improves learning. The example of Turkey, which the video mentions, also shows that a country with resources similar to ours can improve in just a few years.
A critical reading of the video
The analysis is valuable, but it is not without nuance:
- Correlation is not causation. The fact that the countries using AI the least have better scores does not prove that AI is the cause; there may be cultural and education-policy factors behind both.
- Some conclusions are very sweeping. Claiming that the region will “never” be able to develop complex industries because of its level in math works as a wake-up call, but the future depends on what is done from now on.
- The figures deserve a trip to the source. The video summarizes many charts; anyone who wants to make decisions should review the official OECD reports and their own country’s data.
- There is a commercial context. The video recommends Platzi courses. That does not invalidate the analysis, but it is worth keeping in mind.
Even with those caveats, I think its core contribution is right: stop looking for excuses and focus on what we can actually change in the classroom and at home.
School as a “gym for the mind”
The idea the video closes with is powerful. In the past, going to school (colegio, as primary and secondary school is called in Colombia) meant gaining access to scarce knowledge; today knowledge is everywhere. Since the Industrial Revolution, machines have freed us from physical effort, and that is why gyms exist: we need to exercise to stay well. The same will happen with the machines that think for us, and schools will have to become gyms for the mind, places where we force ourselves to think and to feel uncomfortable. Its conclusion: to educate now is to motivate people to think.
Frequently asked questions
What are the PISA tests?
They are the OECD’s international assessments (the Programme for International Student Assessment) that measure the reading, math and science skills of 15-year-old students. They are given every few years in dozens of countries and make it possible to compare education systems.
How did Colombia do in the latest PISA tests?
According to the video’s analysis, Colombia is in Latin America’s middle group, below the OECD average, with a very unequal distribution: its best students outperform Mexico’s best, but its worst are far below.
Why does Latin America do poorly in math?
The video argues that it is not explained only by poverty or corruption, but by a lack of perseverance when facing difficult problems, excessive use of screens for leisure, little training in real computing and a lack of motivation to make the effort to think.
How much screen time is advisable for a student?
According to the findings the video cites, less than one hour a day of screens for leisure is associated with better scores, and each additional hour lowers them. For learning, use stops helping once it exceeds five hours.
Does artificial intelligence make school results worse?
There is no simple relationship. The countries that use it least tend to have better results, but there are exceptions. What matters is using it to learn to think, not to avoid thinking.
Conclusion
PISA results are not a sentence; they are a diagnosis. And the diagnosis the video puts forward is, at heart, hopeful: if the problem is not only poverty or corruption, but perseverance, the use of technology and the motivation to think, then there is a lot that teachers, families, students and Colombia’s education system can do starting tomorrow. Making thinking a daily habit again is everyone’s job.
One last question
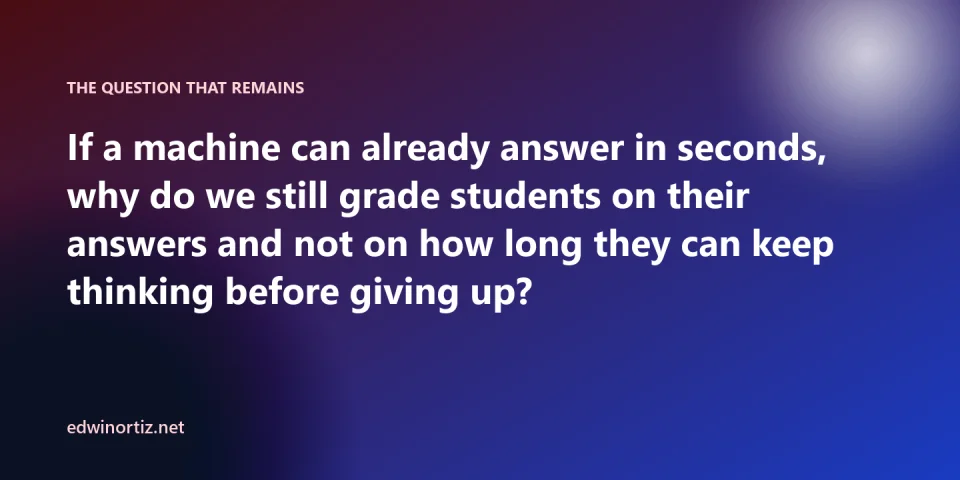
If a machine can already answer in seconds, why do we still grade students on their answers and not on how long they can keep thinking before giving up? Perhaps the next great education reform won’t be about teaching more content, but about assessing the effort of thinking that no machine can do for us.
Prefer to have it ready?
More guides in AI and technology for teachers